• 11 min de lectura
• 11 min de lectura
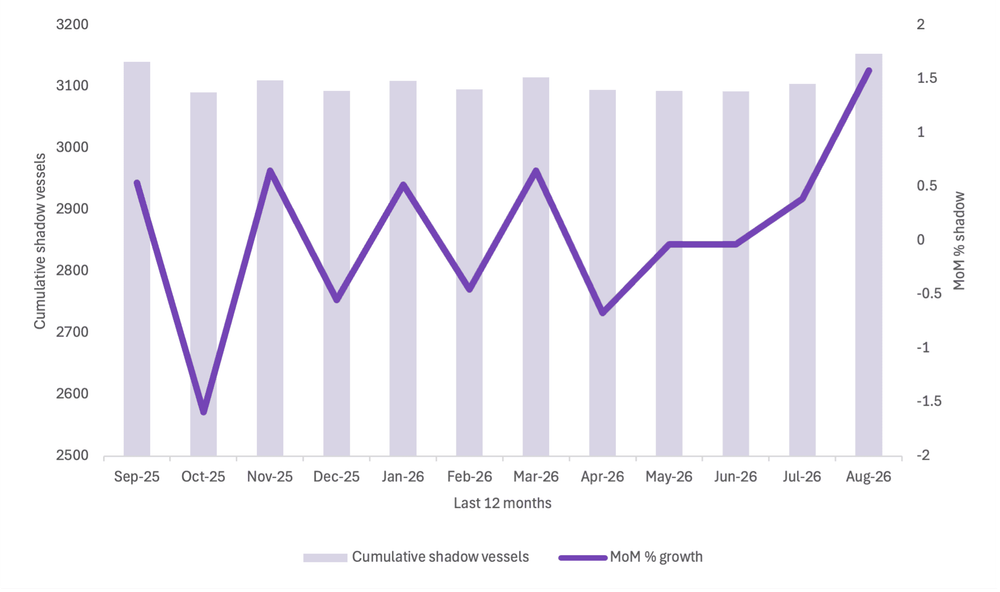
The shadow fleet expanded sharply in August, with 60 vessels entering the fleet and only 11 removals. This produced a net increase of 49 vessels and a +1.58% month-on-month growth rate, taking the cumulative fleet to 3,154 vessels, the highest level in the trailing twelve-month period.
The acceleration is notable compared with recent months. July recorded 33 additions against 21 removals, while August nearly doubled the number of new additions and recorded fewer removals. The resulting +1.58% monthly expansion was the strongest positive growth rate in the twelve-month dataset.
Oil cargo flows through shadow fleet vessels also increased, reaching approximately 326.5 million barrels in August, up from 322.7 MMbbl in July, a rise of around 1.2%. Russia remained the largest named origin at 62.6 MMbbl, despite a monthly decline. Crude remained overwhelmingly dominant at 202.8 MMbbl, accounting for approximately 62% of total flows.
August's new shadow fleet additions are particularly significant. The 60-vessel cohort was associated with approximately 19.3 MMbbl of August flows, substantially above the 12.7 MMbbl recorded by the same cohort in July. Crude alone accounted for 13.1 MMbbl of August activity. The risk profile was dominated by vessels without recognised class or mainstream P&I coverage, with Dark STS also featuring prominently.
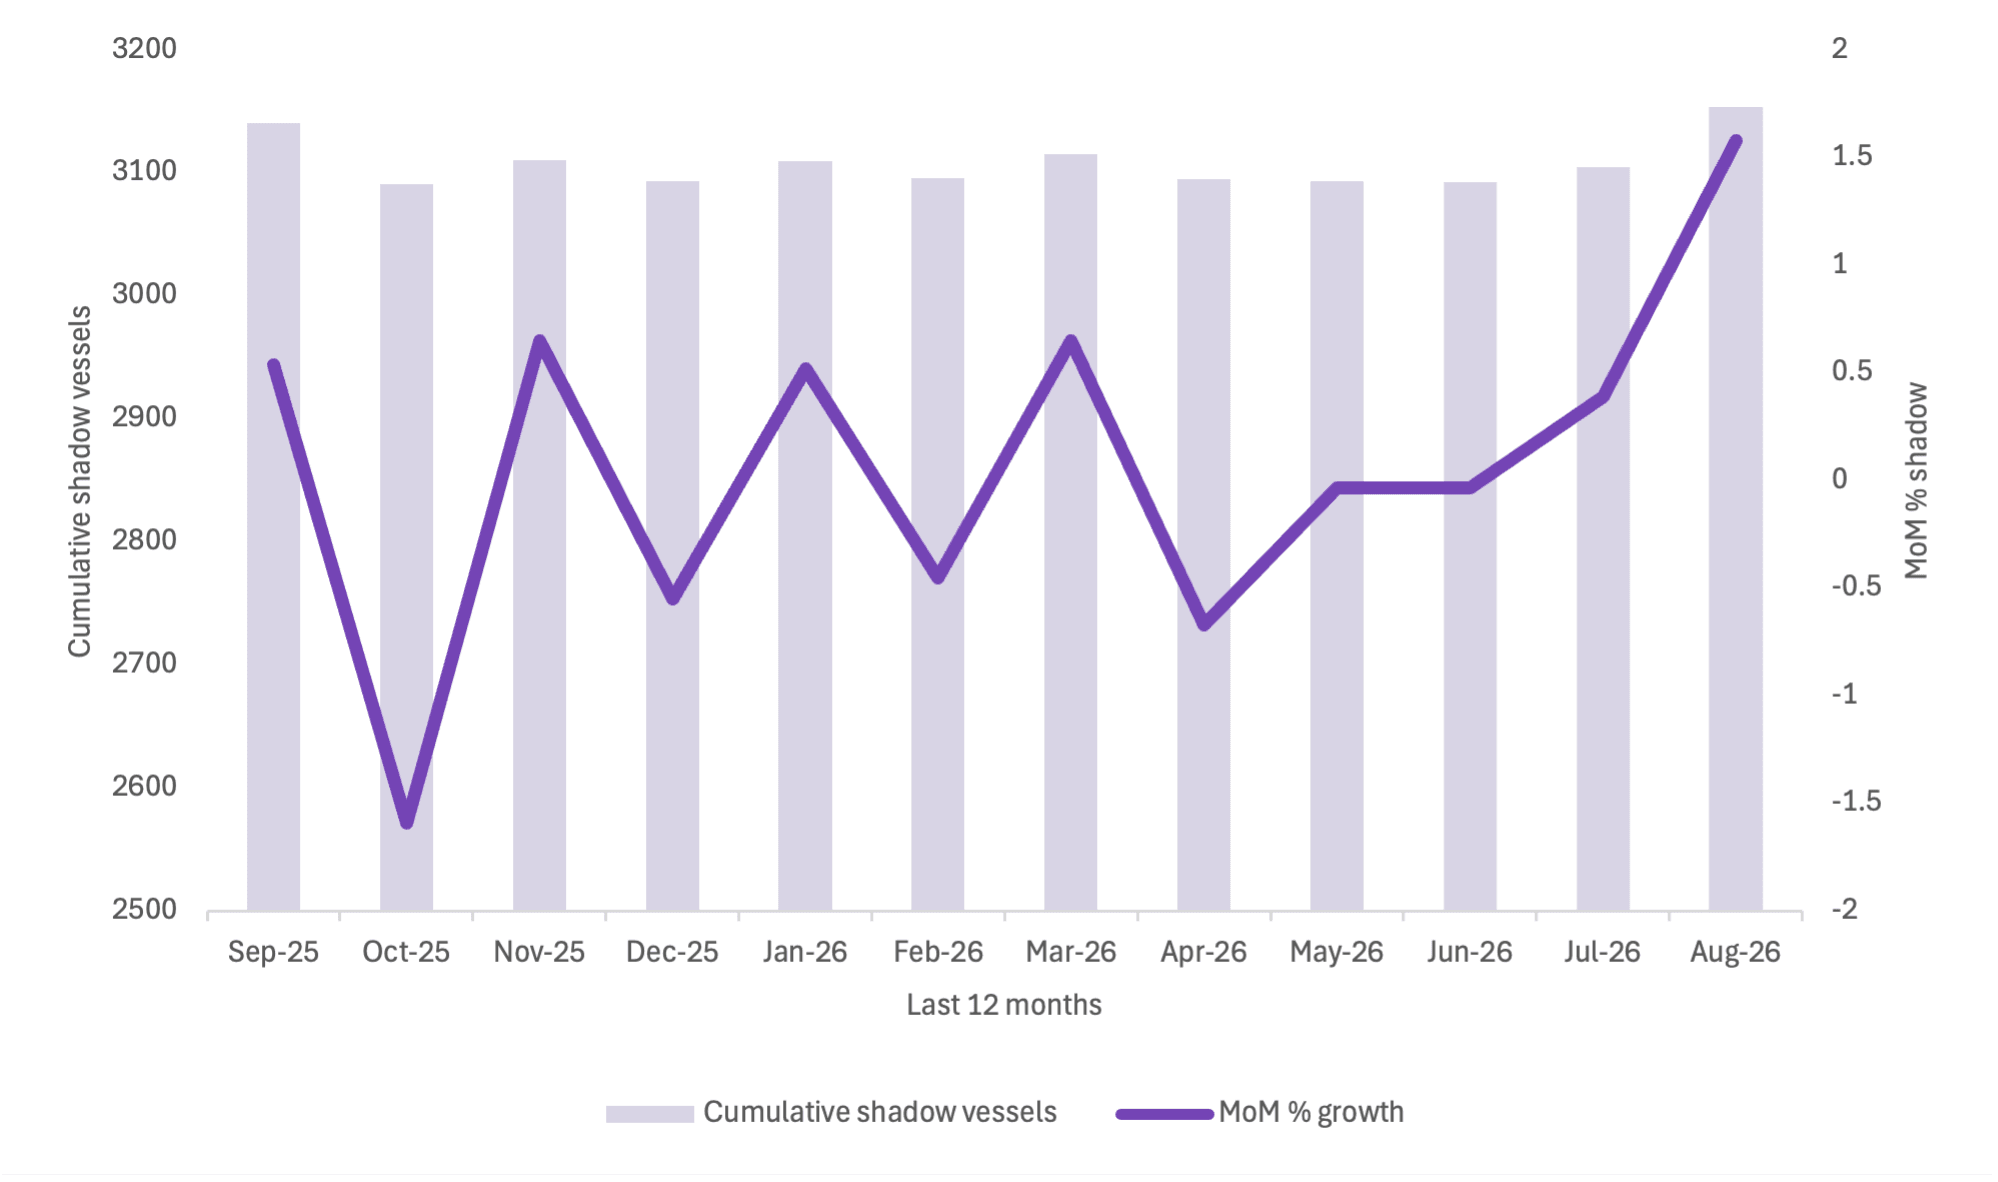 Graph 1. Cumulative shadow vessels during the last 12 months (Sep 2025 - Aug 2026) and Month-over-Month % growth of the fleet - Kpler Risk & Compliance.
August marked a clear acceleration in shadow fleet growth. A total of 60 vessels entered the fleet while only 11 were removed, producing a net increase of 49 vessels. The cumulative total consequently rose from 3,105 vessels in July to 3,154 in August.
At +1.58%, August recorded the strongest positive monthly growth rate in the trailing twelve-month dataset. This represents a significant change from July's +0.39% and follows several months in which the fleet had remained relatively stable around the 3,100-vessel level.
The significance of August therefore lies not only in the new twelve-month high, but also in the speed at which the fleet expanded. New additions were almost twice July's level, while removals fell from 21 to 11. Whether this represents the beginning of a sustained acceleration will depend on subsequent months, but August clearly departed from the relative stability observed between April and July.
For compliance, trading and underwriting teams, the increase expands an already substantial universe of vessels requiring enhanced due diligence. The combination of rapid fleet growth and continued commercial activity means that shadow fleet exposure cannot be assessed solely through sanctions-list screening.
A vessel shall be considered as part of the Shadow fleet if a vessel has loaded cargo with restrictions and at least one of these conditions are met:
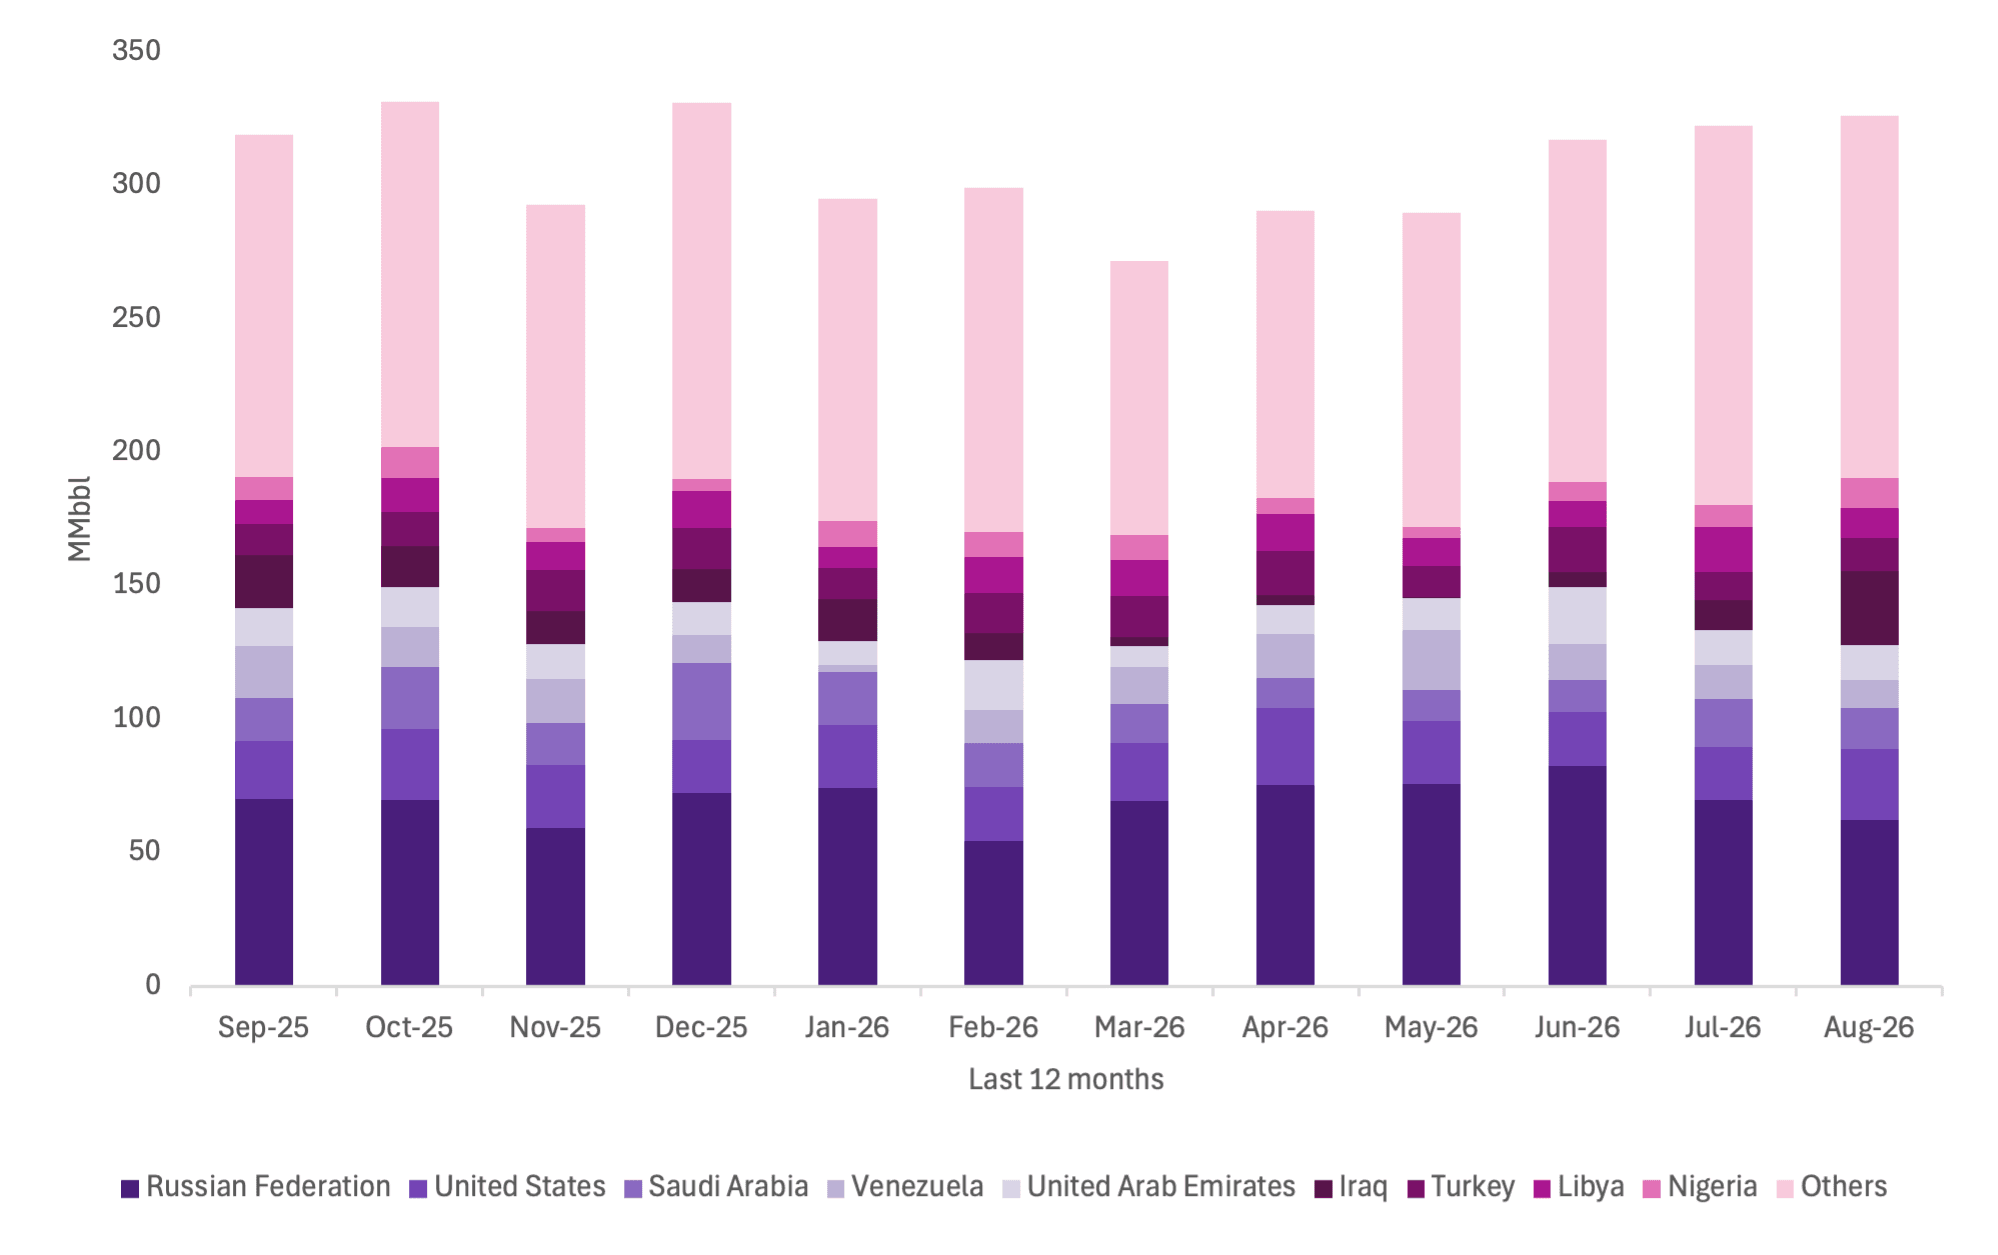 Graph 2. Exports (by origin) in MMbbl from the oil-shadow tankers during the last 12 months (Sep 2025 - Aug 2026) - Kpler Risk & Compliance.
Total shadow fleet oil flows increased from approximately 322.7 MMbbl in July to 326.5 MMbbl in August, representing monthly growth of around 1.2%.
Russia remained the dominant named origin, although volumes declined from 69.8 MMbbl in July to 62.6 MMbbl in August, a decrease of approximately 10%. Russia nevertheless accounted for around 19% of all August flows and remained more than twice as large as any other named origin.
The most striking movement came from Iraq, where shadow fleet-associated flows increased from 10.9 MMbbl to 27.5 MMbbl, a rise of approximately 152% month on month. The United States also increased from 20.1 MMbbl to 26.5 MMbbl. Turkey rose moderately to 12.7 MMbbl and Nigeria increased to 11.1 MMbbl.
By contrast, Saudi Arabia declined from 17.8 MMbbl to 15.2 MMbbl, Venezuela from 12.7 MMbbl to 10.5 MMbbl and Libya from 16.7 MMbbl to 11.2 MMbbl.
The "Others" category remained the largest individual bucket at 135.9 MMbbl, although it declined from 142.2 MMbbl in July. It still represented approximately 42% of total August flows. This continued geographical fragmentation reinforces the importance of assessing individual vessel movements, cargo history and counterparties rather than treating shadow fleet exposure as synonymous with a single country.
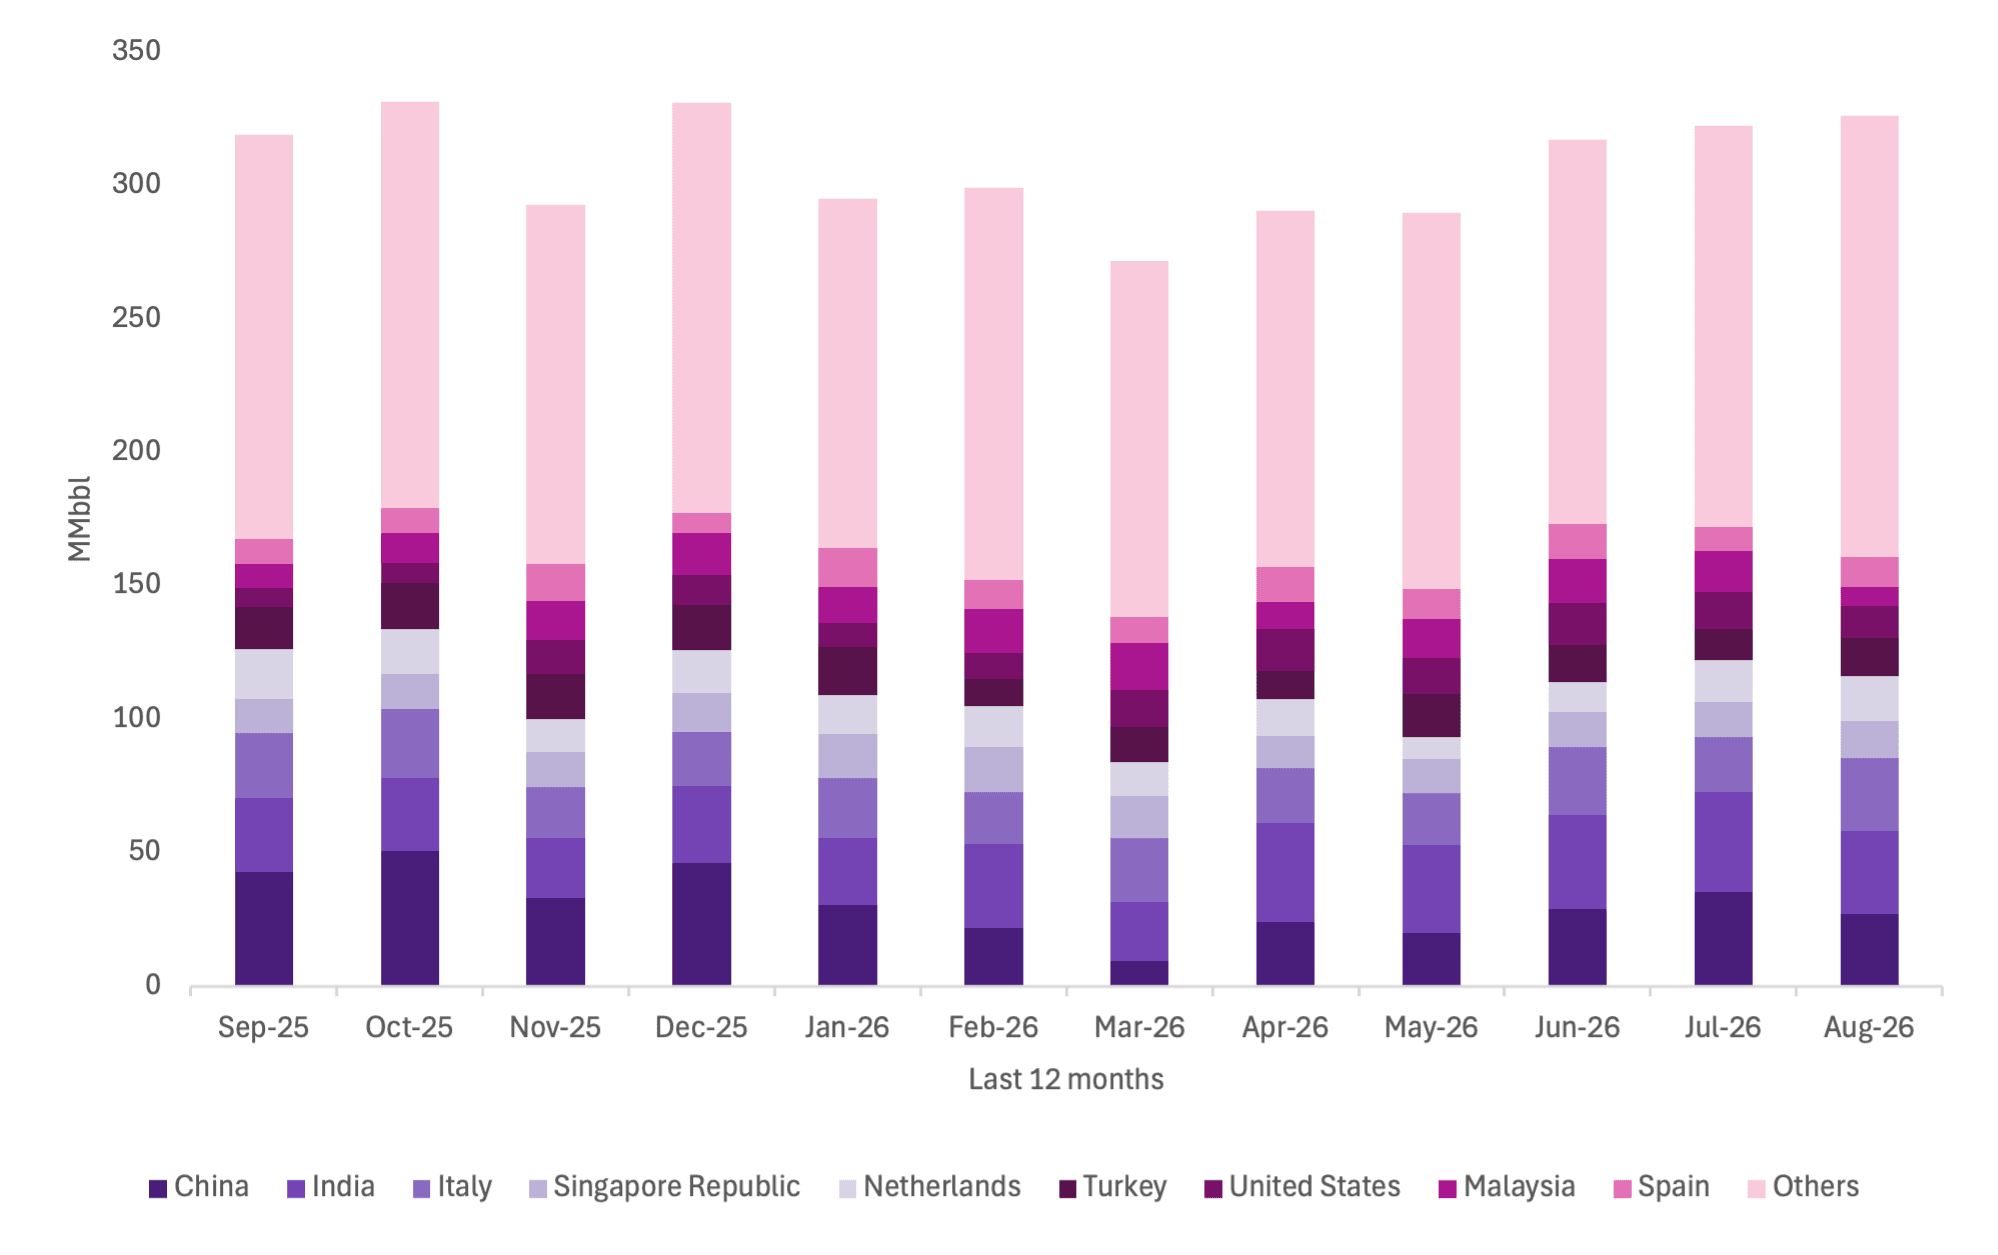 Graph 3. Exports (by destination) in MMbbl from the oil-shadow tankers during the last 12 months (Sep 2025 - Aug 2026) - Kpler Risk & Compliance.
Destination flows became even more fragmented in August. India remained the largest named destination at 31.0 MMbbl, although volumes declined from 37.4 MMbbl in July. China also fell materially, from 35.4 MMbbl to 27.2 MMbbl. Together, the two major Asian destinations therefore received around 14.7 MMbbl less than in July.
Italy moved in the opposite direction, increasing from 20.7 MMbbl to 27.5 MMbbl, making it the second-largest named destination in August, marginally ahead of China. The Netherlands also increased from 15.7 MMbbl to 16.9 MMbbl, while Turkey rose from 11.4 MMbbl to 14.3 MMbbl. Malaysia recorded one of the sharpest declines, falling from 15.5 MMbbl to 7.0 MMbbl. Most importantly, the "Others" destination category increased from 150.2 MMbbl in July to 165.4 MMbbl in August, accounting for approximately 51% of total flows. More than half of August's shadow fleet flows therefore terminated outside the nine largest named destinations shown in the dataset.
The result is a highly dispersed destination profile. While India, Italy and China remain important individual markets, the majority of shadow fleet cargo activity cannot be explained through those headline destinations alone.
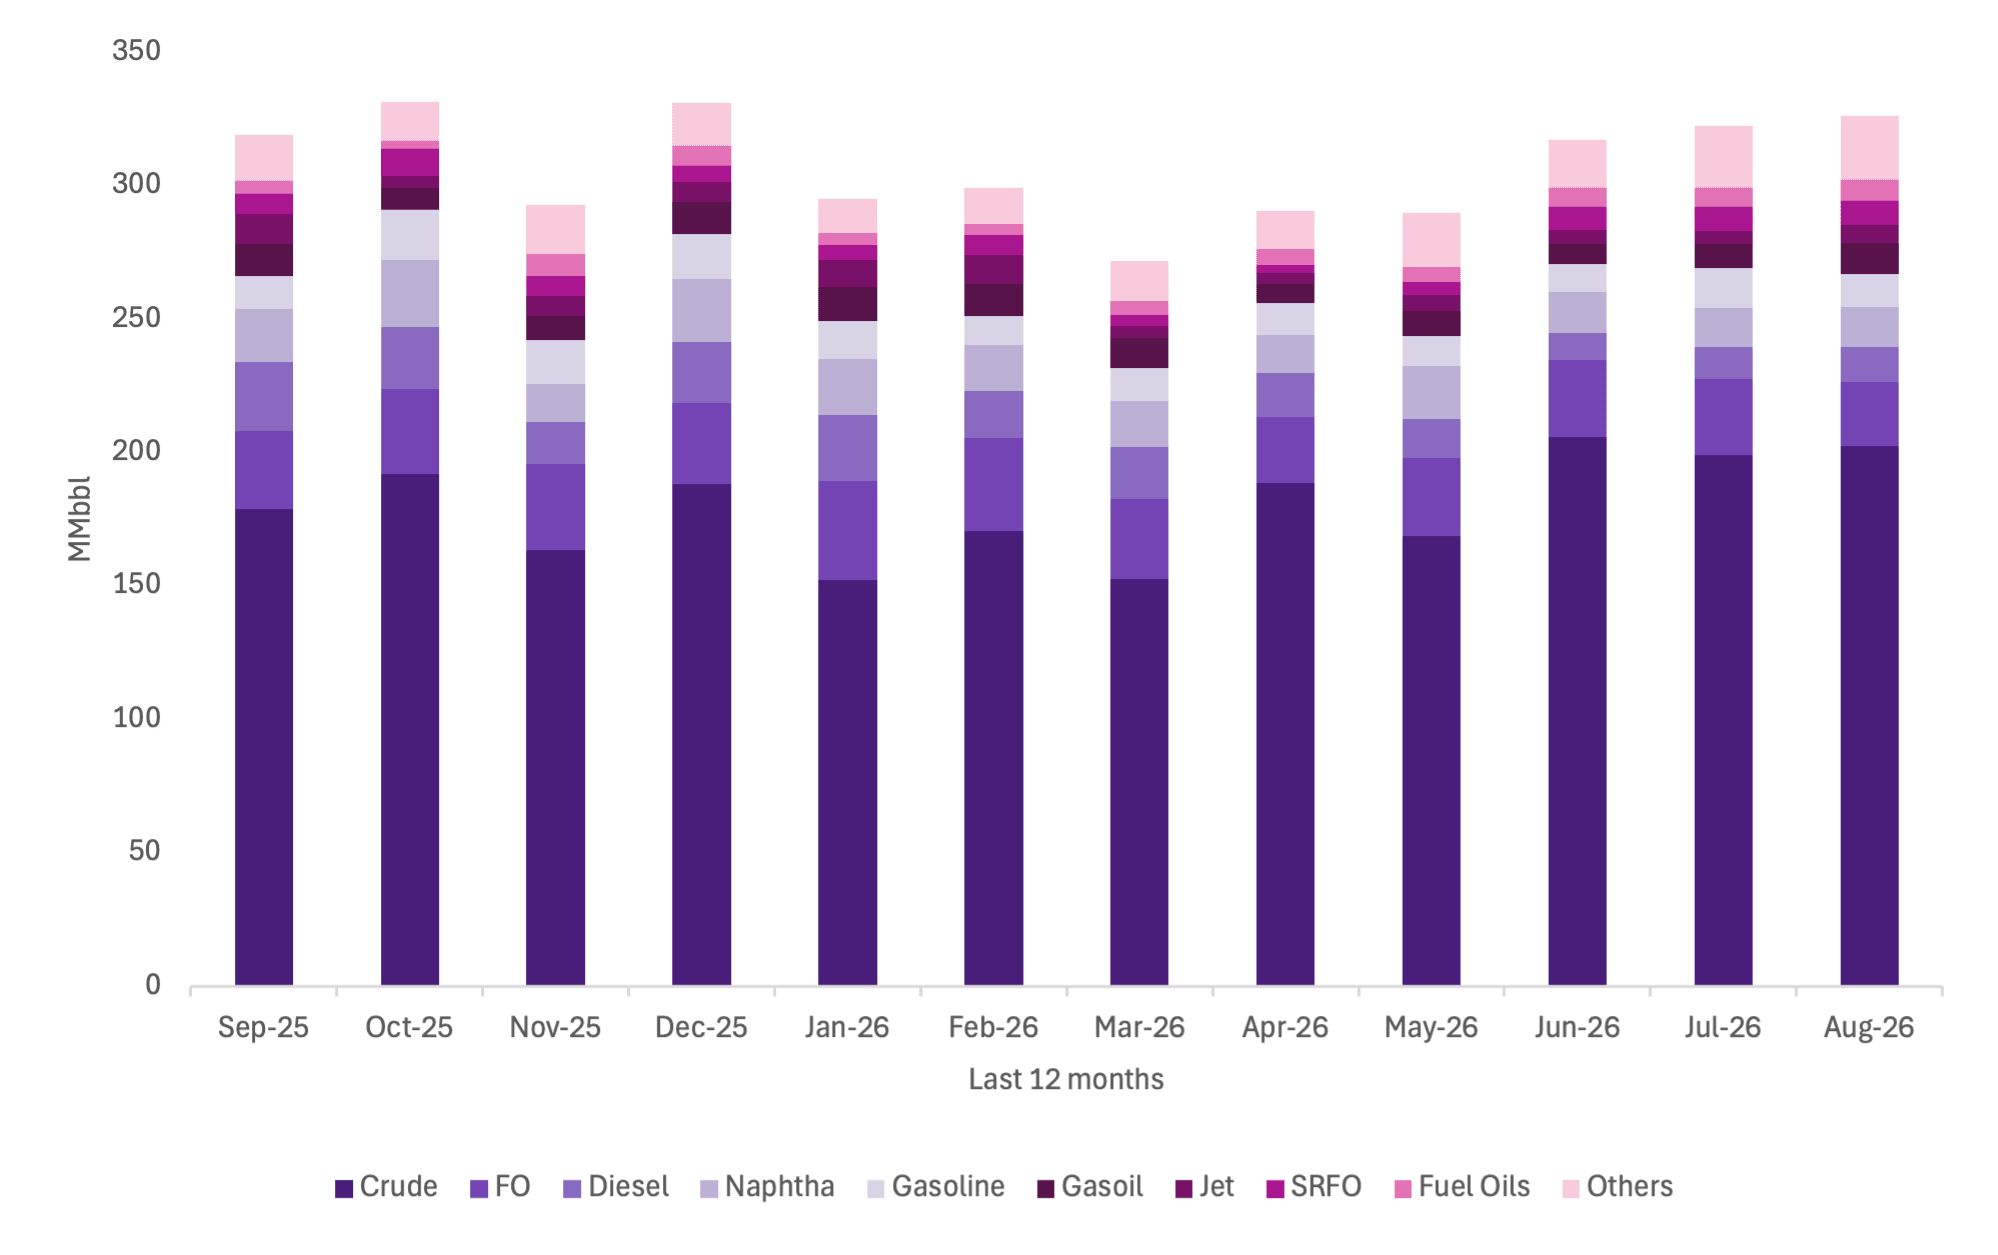 Graph 4. Exports (by product) in MMbbl from the oil-shadow tankers during the last 12 months (Sep 2025 - Aug 2026) - Kpler Risk & Compliance.
Crude remained the backbone of shadow fleet trading activity. Volumes increased from 199.2 MMbbl in July to 202.8 MMbbl in August, accounting for approximately 62% of total flows. Fuel oil declined from 28.4 MMbbl to 23.8 MMbbl, while diesel increased modestly from 12.2 MMbbl to 13.2 MMbbl. Naphtha was broadly stable at 14.7 MMbbl.
Several smaller product categories recorded increases. Gasoil rose from 9.0 MMbbl to 11.7 MMbbl, while jet increased from 4.8 MMbbl to 6.8 MMbbl. The "Others" category remained broadly stable at 24.3 MMbbl.
The overall product composition therefore changed relatively little despite the increase in total flows. Unlike July, when changes in smaller product categories played a larger role in the monthly movement, August's increase was accompanied by further growth in crude volumes.
This remains an important compliance consideration. Shadow fleet exposure extends across multiple petroleum products, but crude continues to account for almost two-thirds of the overall volume moved by these vessels.
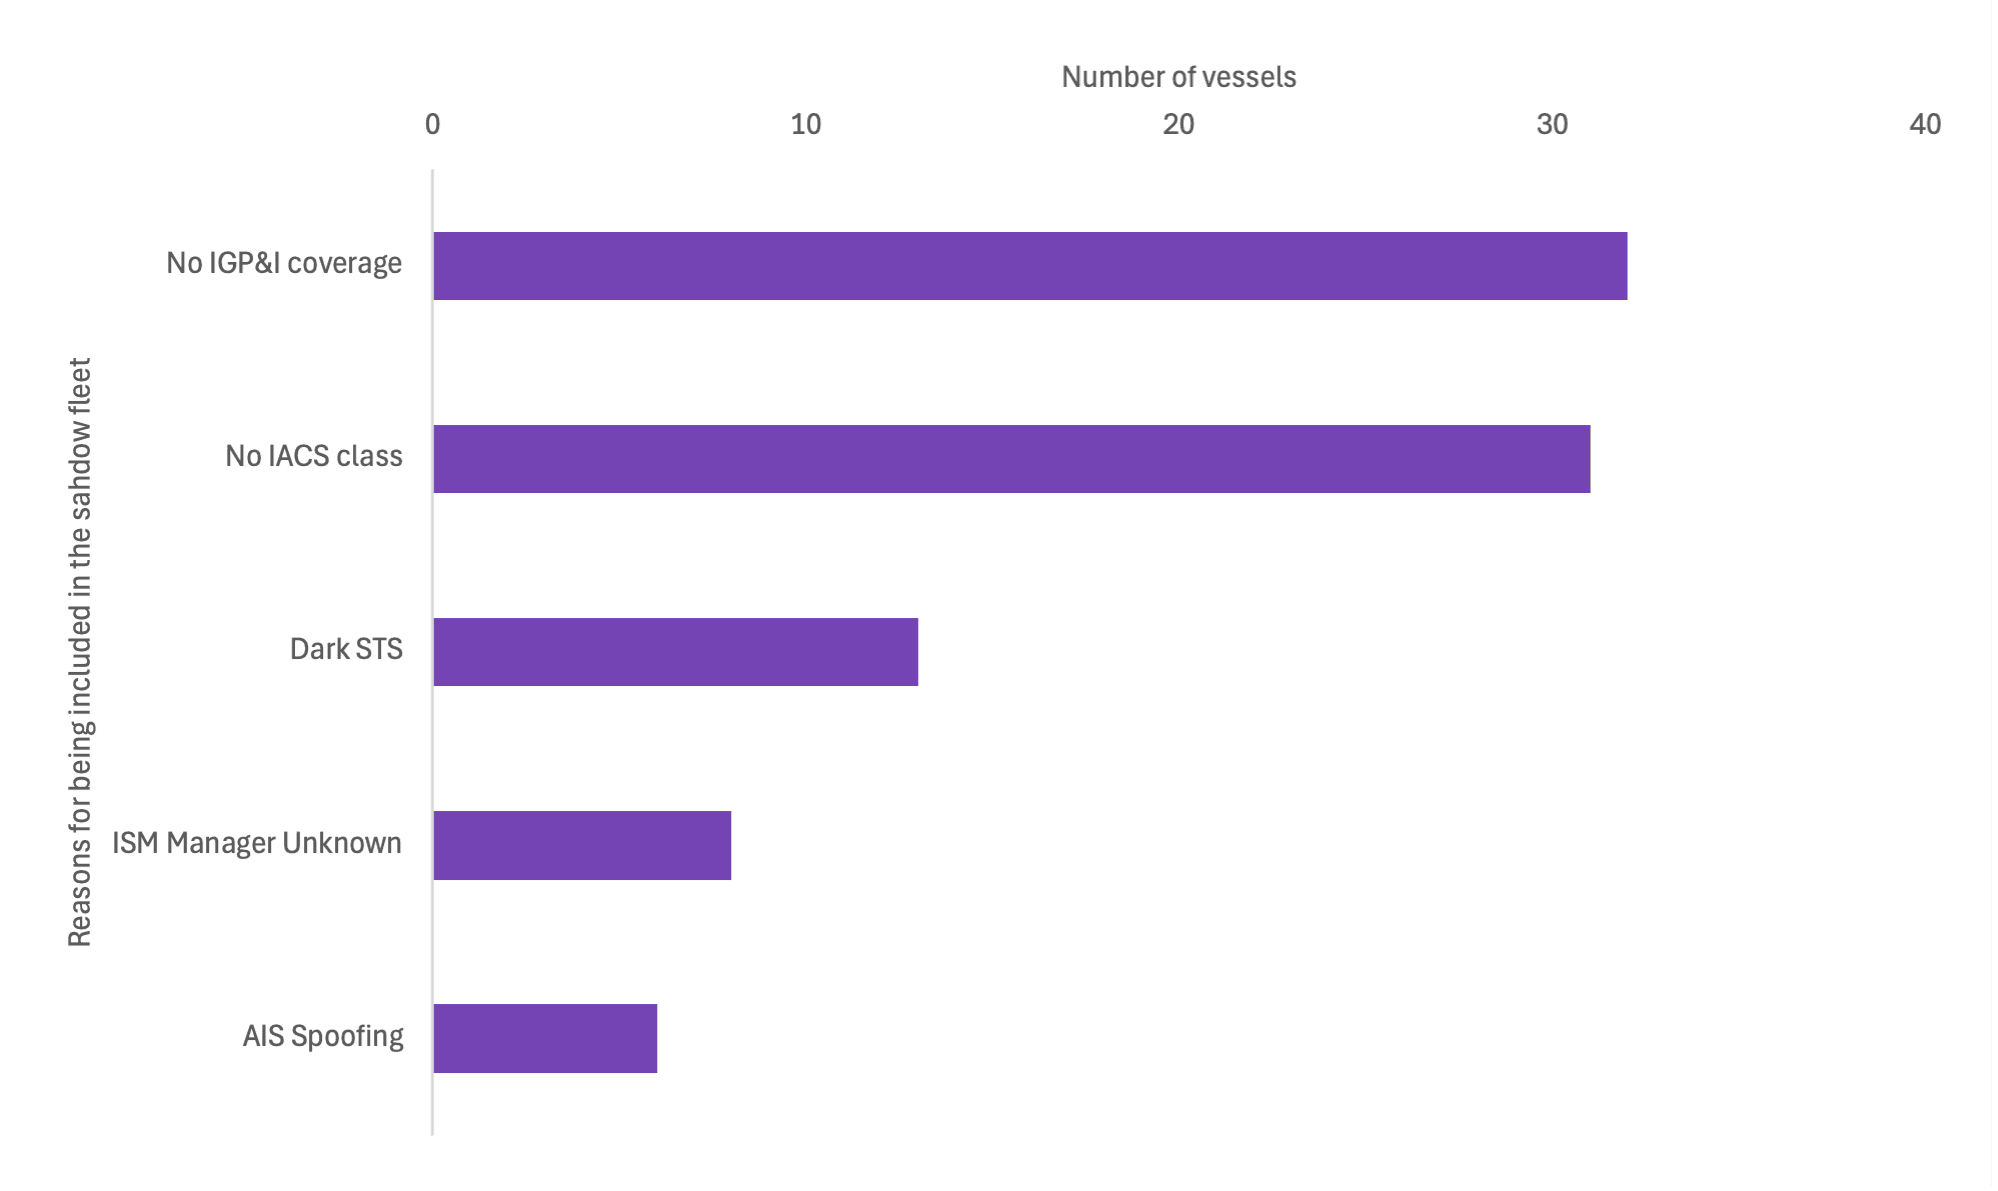 Graph 5. Shadow vessels reasons for additions in August 2026 (along with the cargo risks) - Kpler Risk & Compliance.
The 60 vessels added to the shadow fleet in August present a strongly concentrated structural-risk profile. No IGP&I coverage was identified across 32 vessels, approximately 53% of all August additions, making the absence of mainstream P&I coverage the most prevalent individual indicator.
Almost equally significant was No IACS class, recorded across 31 vessels, or approximately 52% of the cohort. The near overlap between these two indicators demonstrates how heavily August's additions were characterised by vessels operating outside established insurance and classification frameworks.
Behavioural indicators were also material. Dark STS was identified across 13 vessels, representing approximately 22% of the cohort. Eight vessels had an unknown ISM Manager, while AIS spoofing was identified across six vessels.
No new August additions were associated with False Flag or ID Manipulation indicators in the dataset. As vessels can meet multiple shadow fleet conditions simultaneously, these categories are not mutually exclusive.
The August cohort therefore combines two distinct types of exposure. The first is structural: lack of IGP&I insurance, non-IACS classification and opaque management. The second is behavioural: Dark STS activity and AIS spoofing. Their overlap is particularly relevant because it can combine reduced institutional oversight with operational attempts to obscure vessel or cargo activity.
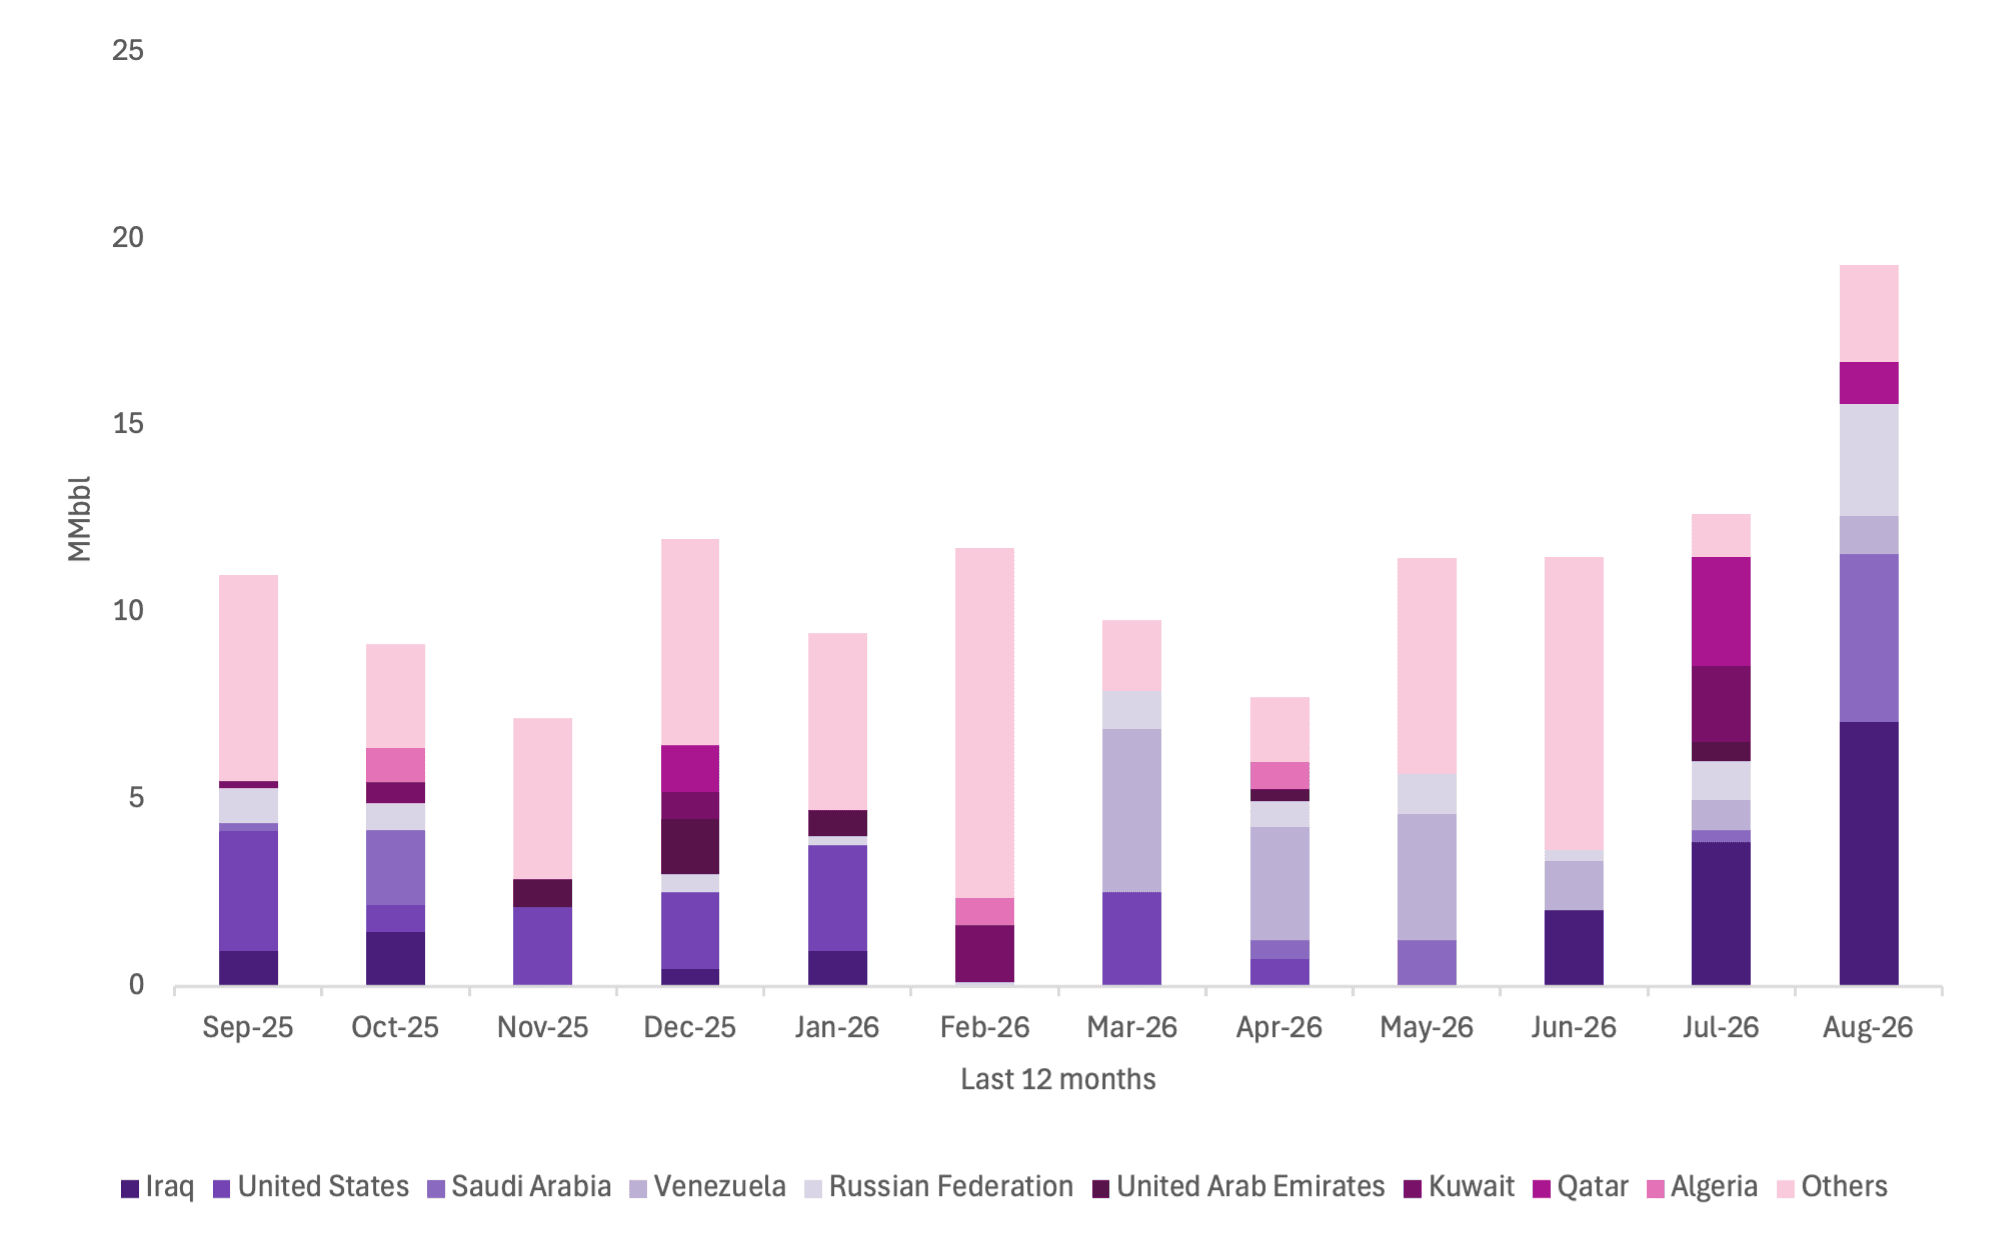 Graph 6. Exports (by origin) in MMbbl during the last 12 months (Sep 2025 - Aug 2026) from the oil-shadow tankers that joined the shadow fleet in August 2026 - Kpler Risk & Compliance.
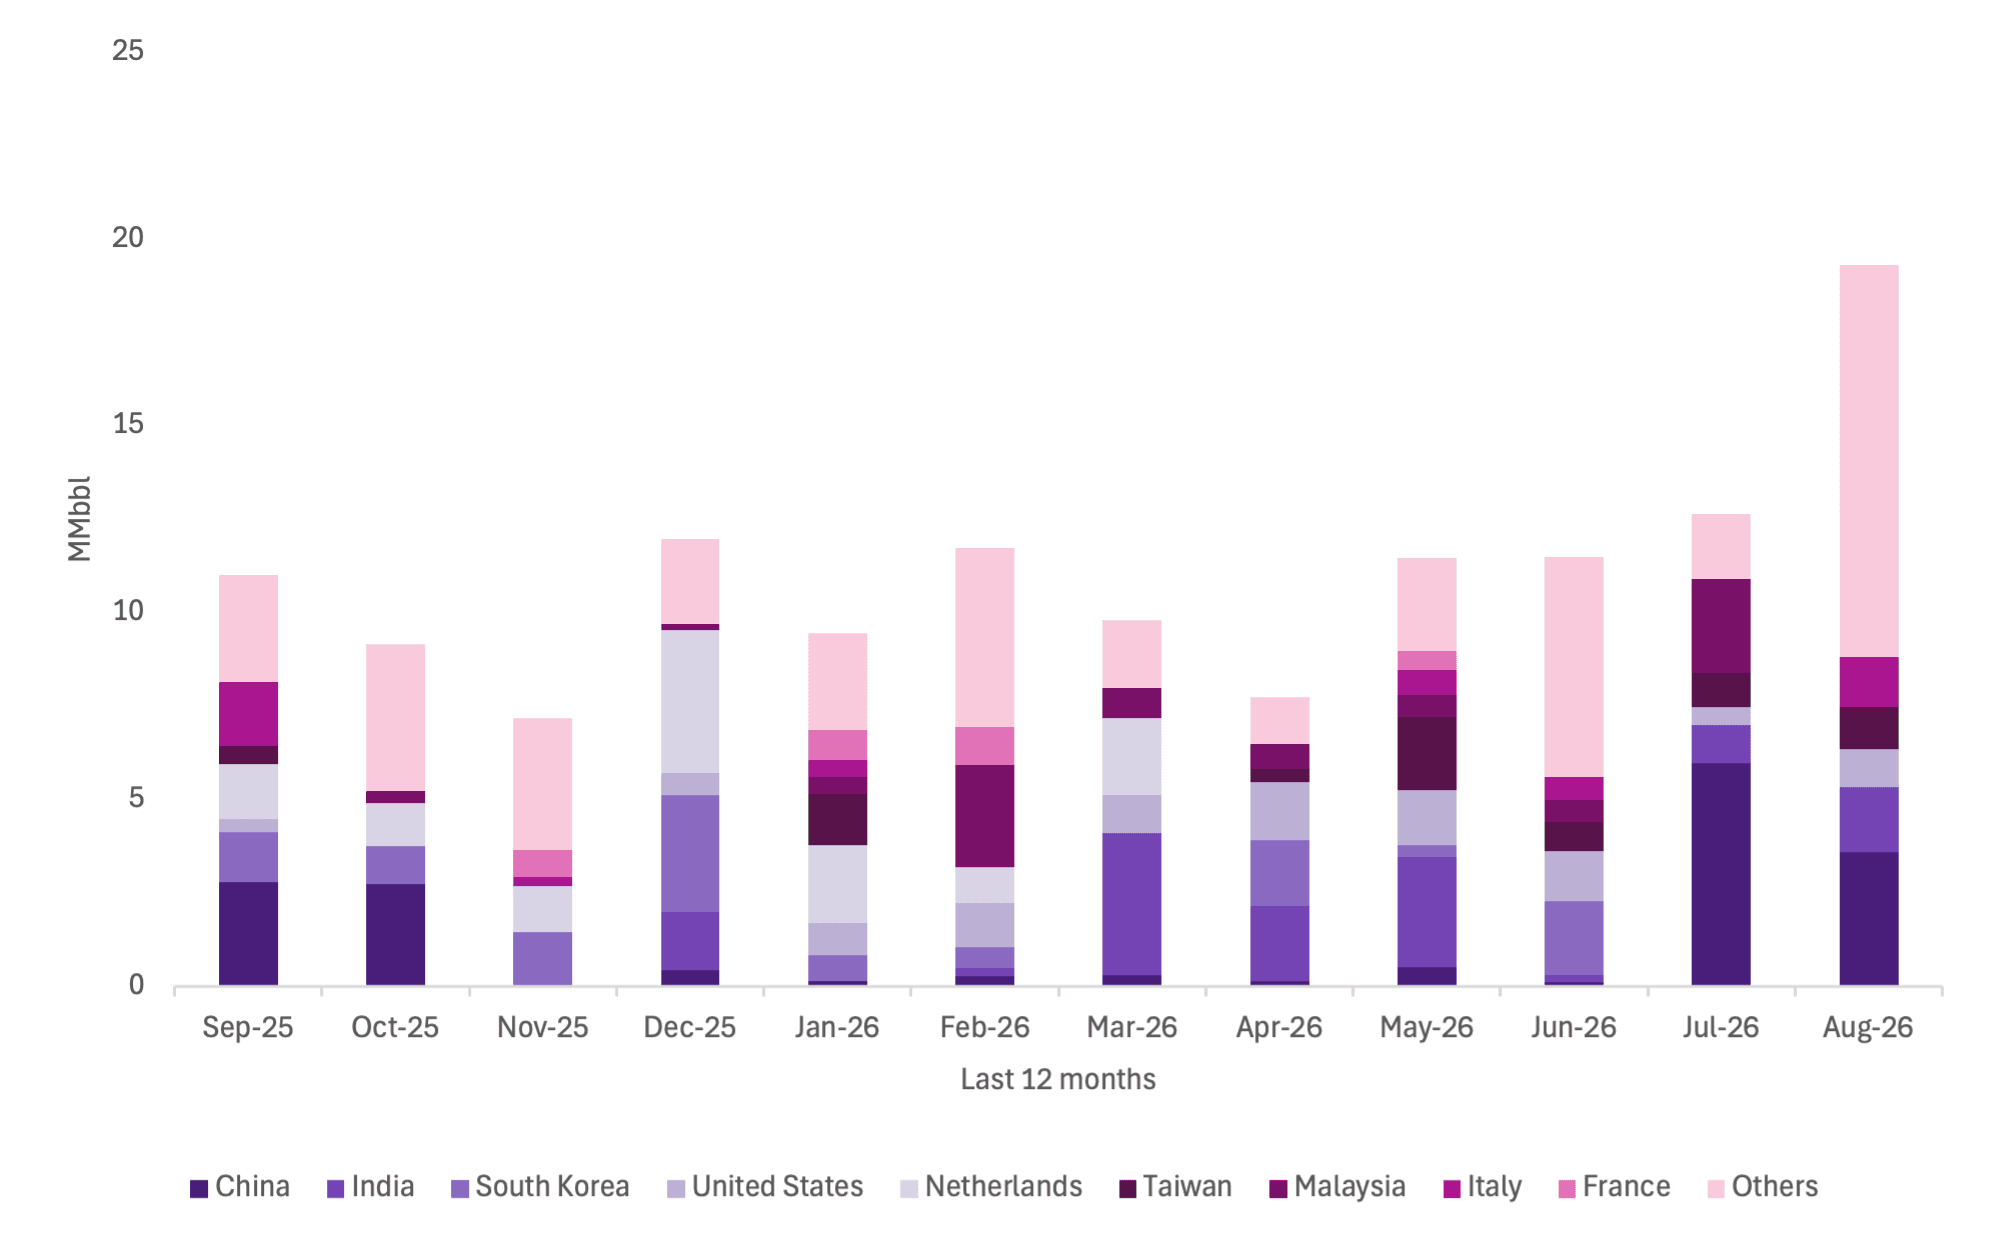 Graph 7. Exports (by destination) in MMbbl during the last 12 months (Sep 2025 - Aug 2026) from the oil-shadow tankers that joined the shadow fleet in August 2026 - Kpler Risk & Compliance.
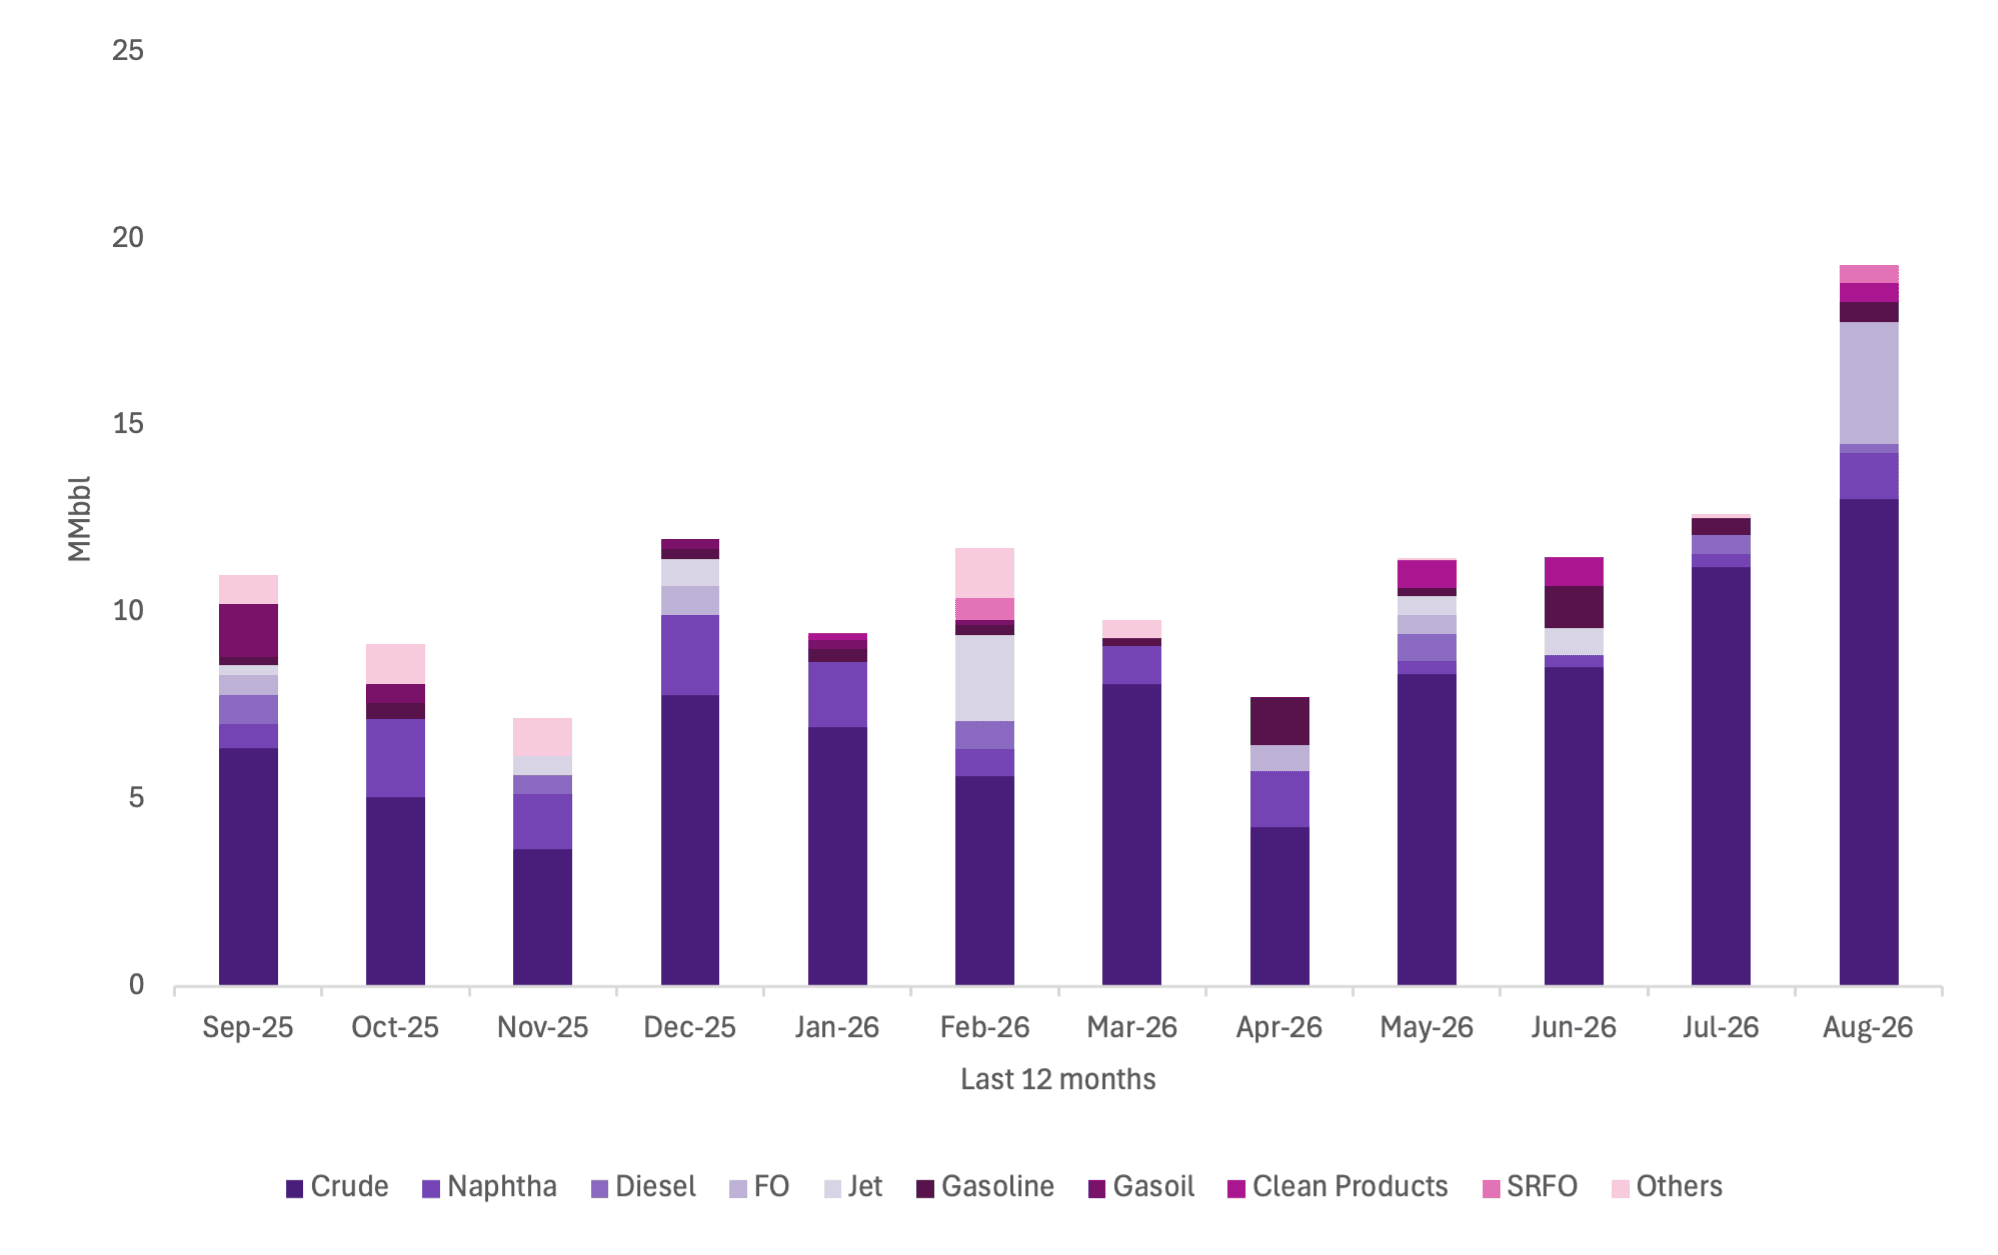 Graph 8. Exports (by product) in MMbbl during the last 12 months (Sep 2025 - Aug 2026) from the oil-shadow tankers that joined the shadow fleet in August 2026 - Kpler Risk & Compliance.
The commercial activity associated with August's additions is one of the strongest signals in this month's dataset.
The vessels that entered the shadow fleet in August were associated with approximately 19.3 MMbbl of August flows, up from around 12.7 MMbbl in July for the same vessel cohort. This was the highest monthly volume associated with these vessels across the trailing twelve-month period.
On the origin side, Iraq dominated at 7.1 MMbbl, accounting for approximately 37% of August cohort flows. Saudi Arabia followed at 4.5 MMbbl and Russia at 3.0 MMbbl. Qatar accounted for 1.1 MMbbl and Venezuela for 1.0 MMbbl, while the "Others" category contributed 2.6 MMbbl.
The destination profile was considerably more dispersed. The "Others" category accounted for 10.5 MMbbl, or approximately 54% of August flows. China was the largest named destination at 3.6 MMbbl, followed by India at 1.7 MMbbl, Italy at 1.3 MMbbl, Taiwan at 1.1 MMbbl and the United States at 1.0 MMbbl.
The product profile remained strongly crude-oriented. Crude reached 13.1 MMbbl, accounting for approximately 68% of the cohort's August flows. Fuel oil contributed a further 3.3 MMbbl, followed by naphtha at 1.2 MMbbl. Smaller volumes were recorded across gasoline, clean products, SRFO and diesel.
The significance is the combination of risk and activity. August did not simply add a large number of dormant or marginal vessels to the shadow fleet universe. The newly classified cohort was actively involved in substantial cargo movements, including 13.1 MMbbl of crude in August alone.
August represents the clearest acceleration in shadow fleet expansion observed over the trailing twelve months. Sixty vessels entered the fleet and only 11 were removed, increasing the cumulative fleet to 3,154 vessels and producing monthly growth of +1.58%. The net addition of 49 vessels was considerably stronger than the movements recorded in recent months.
Cargo activity remained equally significant. Total shadow fleet oil flows reached approximately 326.5 MMbbl, the highest level in the twelve-month dataset shown here. Crude remained dominant at 202.8 MMbbl, while Russia continued to lead named origins despite a monthly decline.
However, August also illustrates why headline Russia exposure alone provides an incomplete picture of shadow fleet activity. Iraq-origin volumes more than doubled to 27.5 MMbbl, while the "Others" category continued to represent around 42% of origins. On the destination side, more than half of all volumes fell within "Others", despite India, Italy and China remaining important named markets.
The month's new additions reinforce that concern. More than half of the 60 newly classified vessels lacked IGP&I coverage, and a similar proportion lacked IACS classification. Dark STS was identified across 13 vessels and AIS spoofing across six. At the same time, these vessels were associated with 19.3 MMbbl of August cargo movements, approximately 68% of which was crude.
For compliance teams, August's development is therefore not simply a story of a larger shadow fleet. It is the combination of faster fleet expansion, substantial commercial activity and overlapping structural and behavioural risk indicators that matters. Screening strategies should continue moving beyond sanctions designations alone and incorporate insurance, classification, management transparency, AIS behaviour, Dark STS activity and vessel-level trading history into counterparty and voyage due diligence.