

• 7 min de lectura
• 7 min de lectura
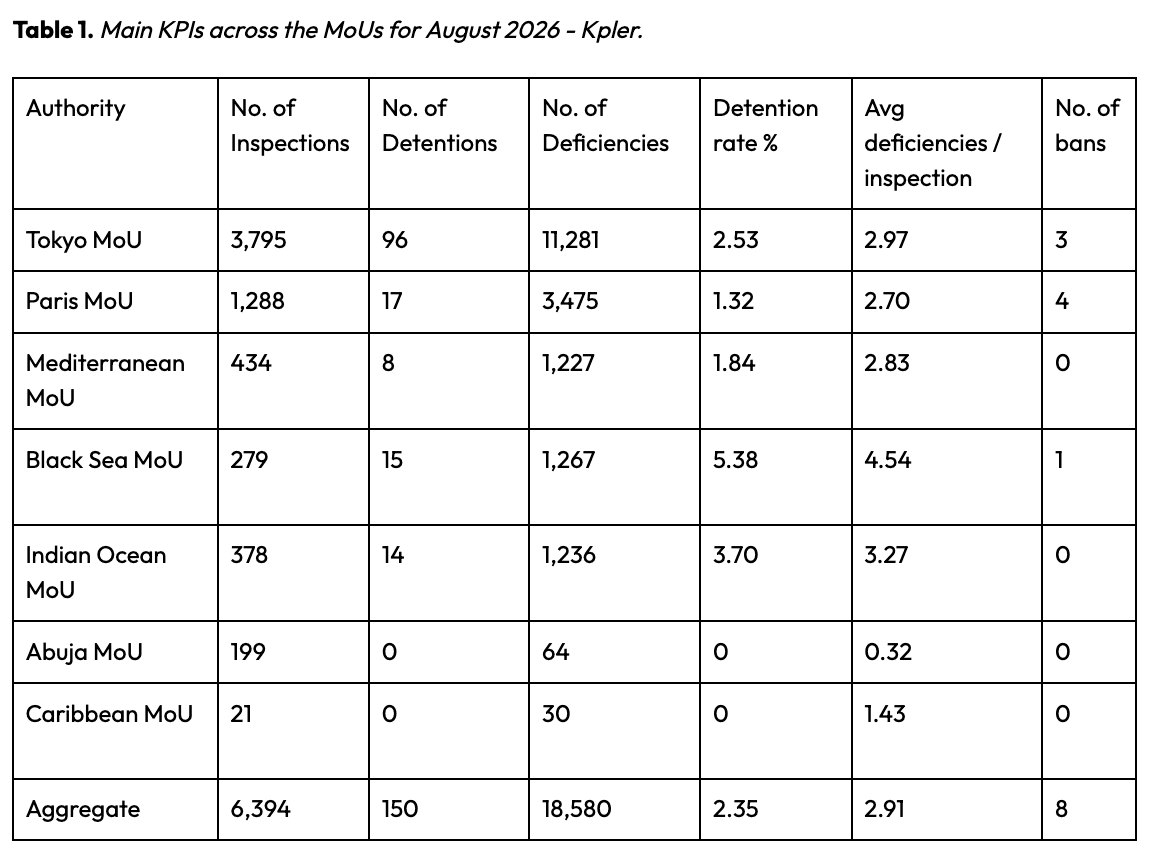
Global Port State Control (PSC) activity in August 2026 comprised 6,394 inspections and 150 detentions, representing an aggregate detention rate of 2.35%. The Tokyo MoU carried the bulk of inspection volume (3,795 inspections) at a detention rate of 2.53%, while the Black Sea MoU recorded the highest regional detention rate at 5.38%, alongside a high average of 4.54 deficiencies per inspection. Compared with July 2026, detention rates declined across the Tokyo, Paris, Mediterranean, and Abuja MoUs, while rising in the Black Sea and Indian Ocean MoUs.
In August 2026, Port State Control (PSC) authorities conducted a total of 6,394 inspections, resulting in 150 detentions, 18,580 recorded deficiencies, and 8 vessel bans. This corresponds to an aggregate detention rate of 2.35%, with an average of 2.91 deficiencies per inspection. The Black Sea MoU registered the highest detention rate at 5.38%, followed by the Indian Ocean MoU at 3.70%. In terms of inspection volume, the Tokyo MoU led with 3,795 inspections and accounted for the largest share of deficiencies (11,281). Of the 8 bans recorded in August, the Paris MoU issued 4, while the Tokyo MoU accounted for 3, and the Black Sea MoU accounted for 1.
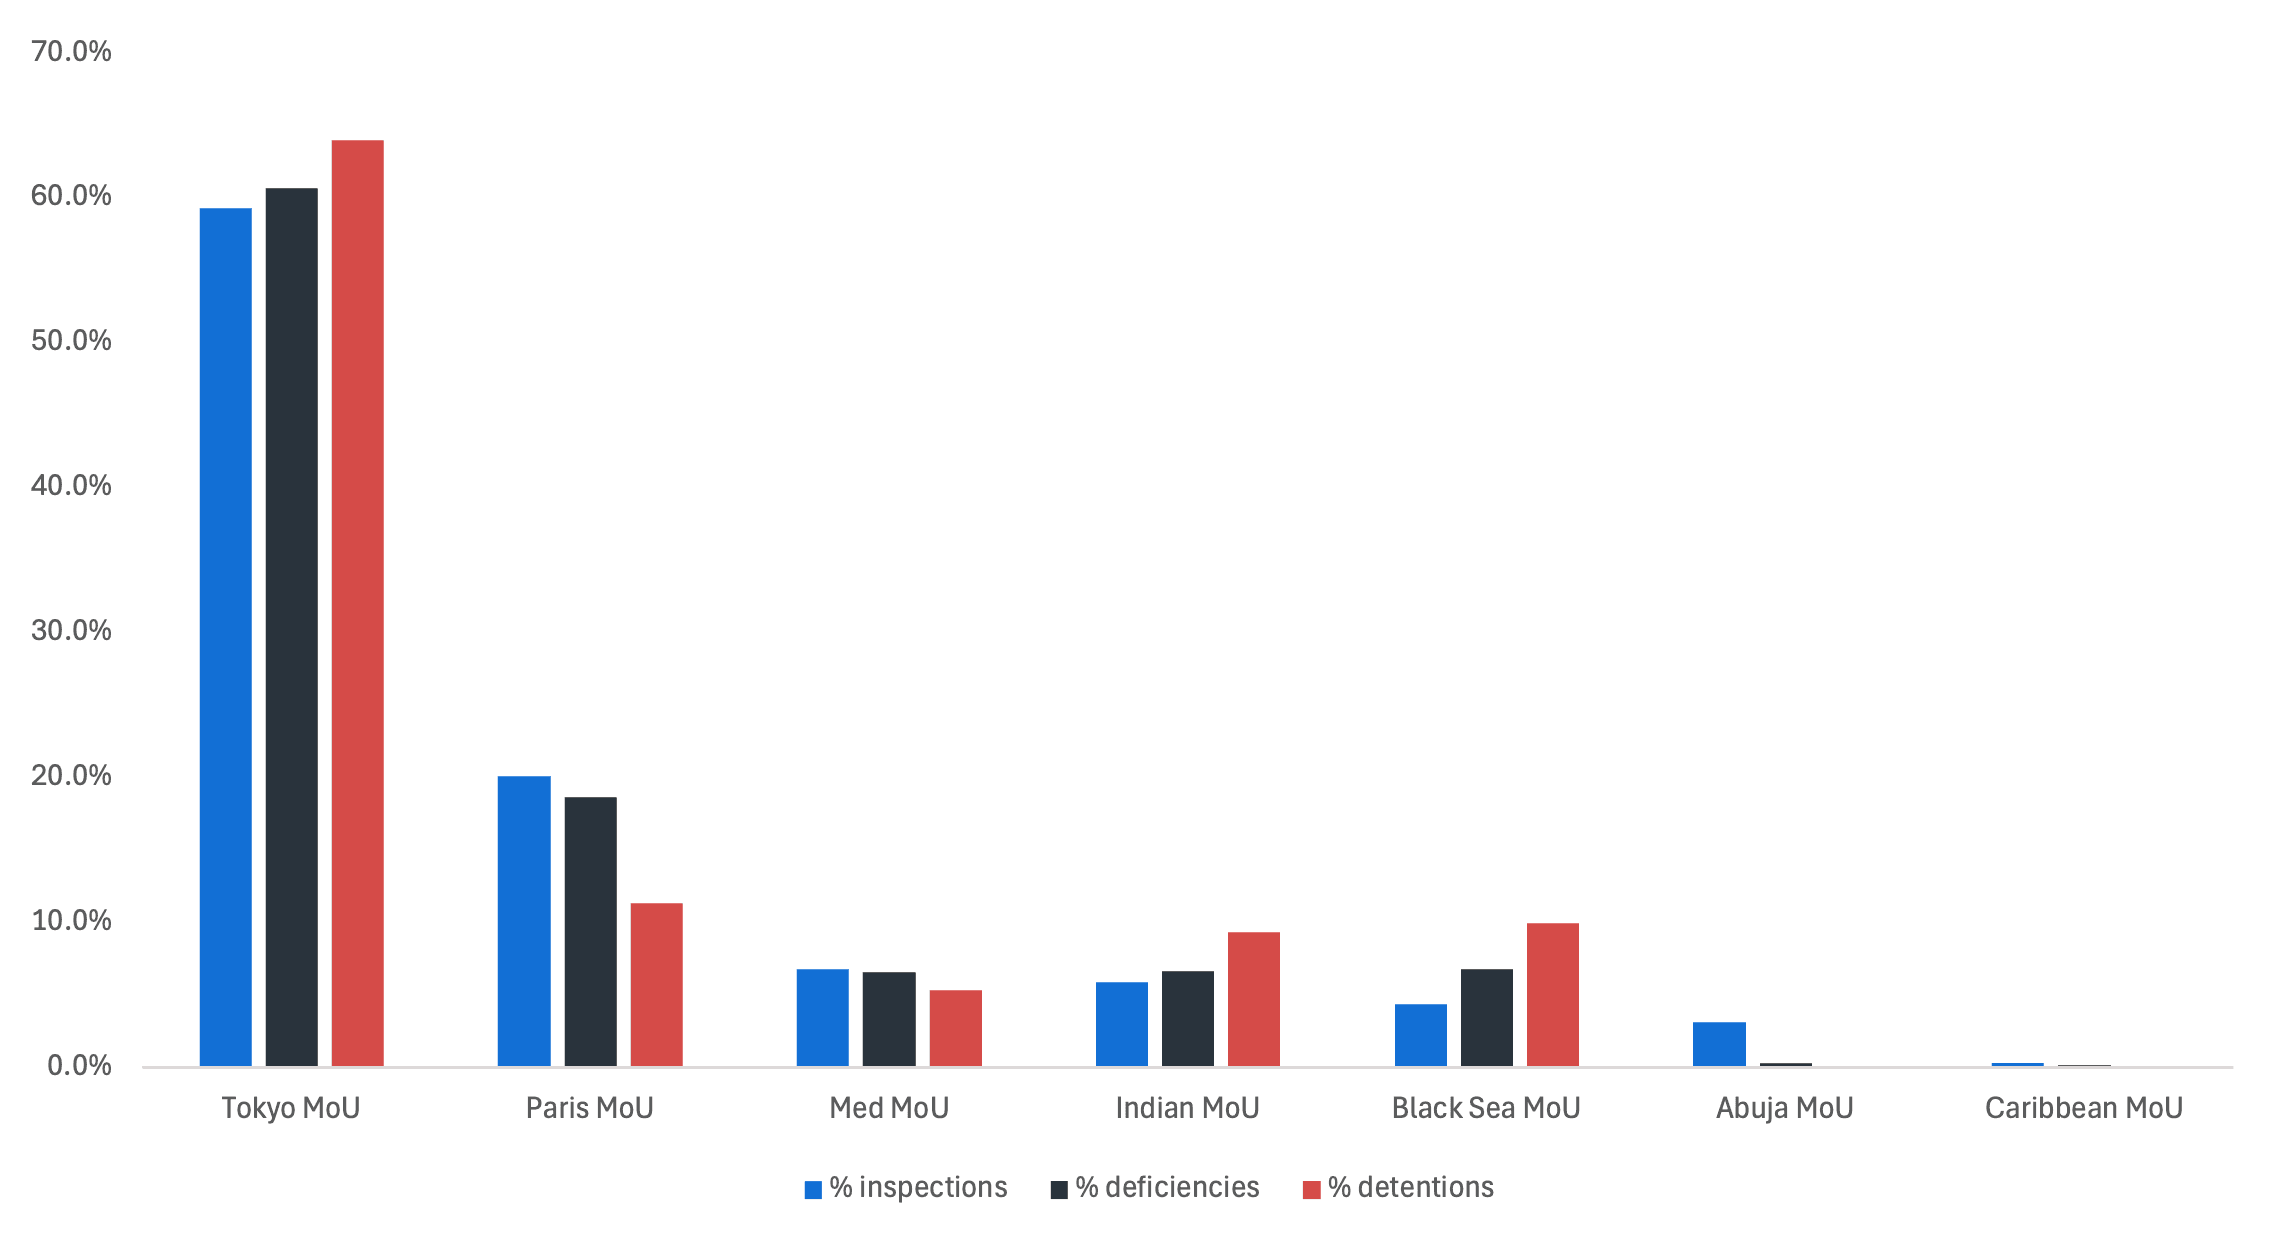 Graph 1. Distribution of Inspections, Deficiencies, and Detentions by MoU (% of all events across all PSCs, August 2026) - Kpler.
The Tokyo MoU continued to dominate overall PSC activity in August 2026, accounting for 59.4% of inspections, 60.7% of all recorded deficiencies, and 64.0% of detentions. The Paris MoU followed with 20.1% of inspections and 18.7% of deficiencies, but contributed a comparatively modest share of detentions at 11.3%. The Mediterranean MoU recorded a broadly aligned enforcement outcome, with a 5.3% detention share tracking close to its 6.8% inspection share, while the Black Sea MoU's deficiency share of 6.8% and detention share of 10.0% both notably exceeded its 4.4% inspection share, highlighting an elevated enforcement burden in the region. The Indian Ocean MoU showed a similar pattern, accounting for 5.9% of inspections but 9.3% of detentions, reflecting a firmer enforcement profile relative to its activity level. Meanwhile, the Abuja and Caribbean MoUs maintained minimal activity, together contributing 3.4% of inspections and no recorded detentions, representing a relatively small share of the inspections captured in this analysis.
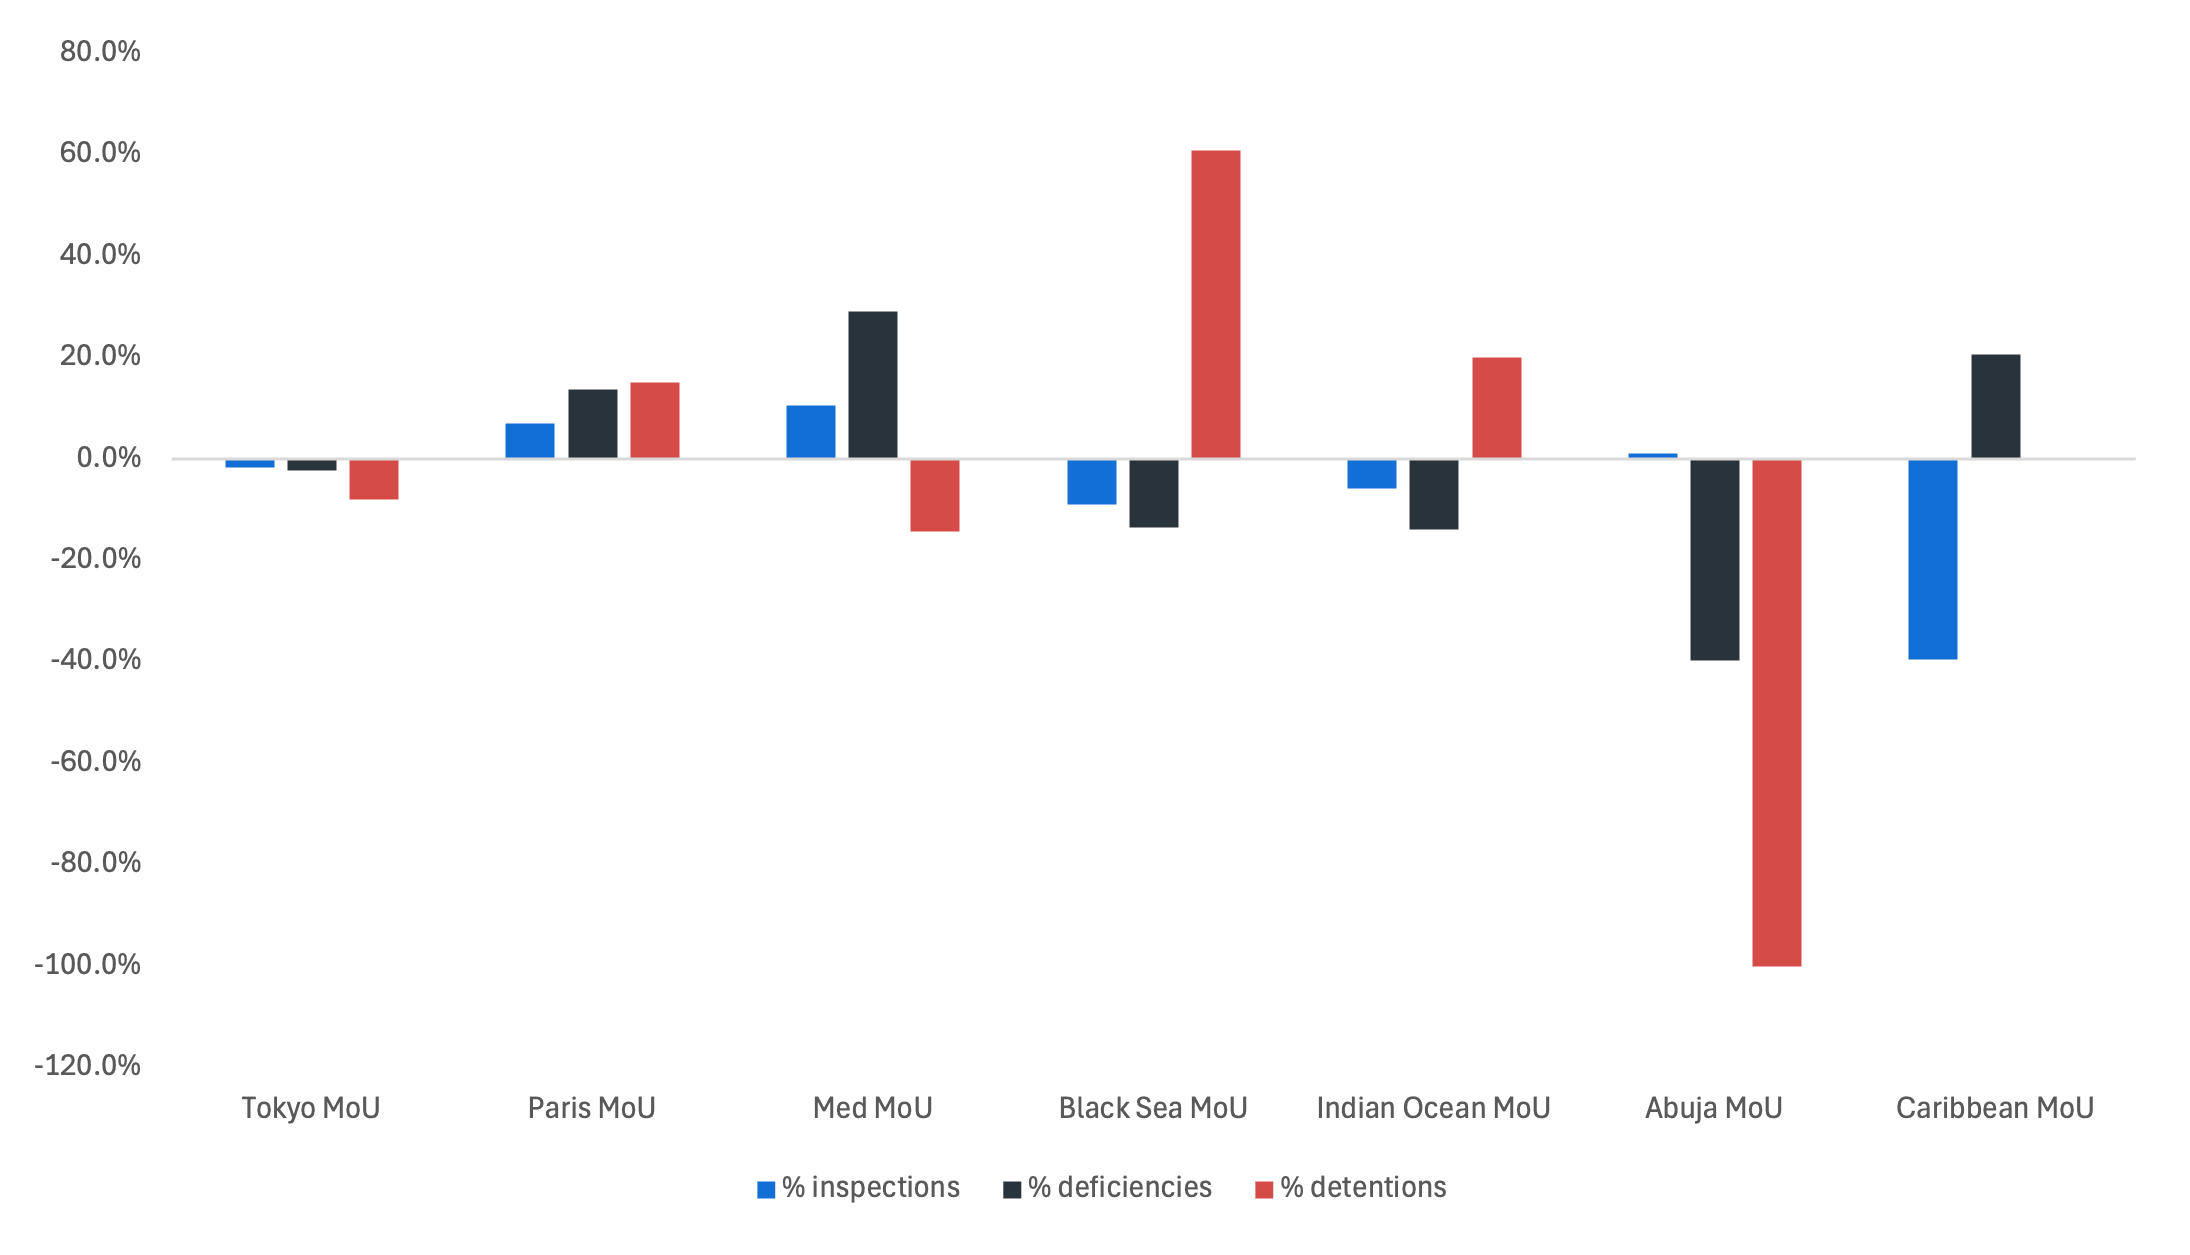 Graph 2. MoM Changes for August 2026 vs. July 2025 on Distribution of Inspections, Deficiencies, and Detentions by MoU (% of Aggregate) - Kpler.
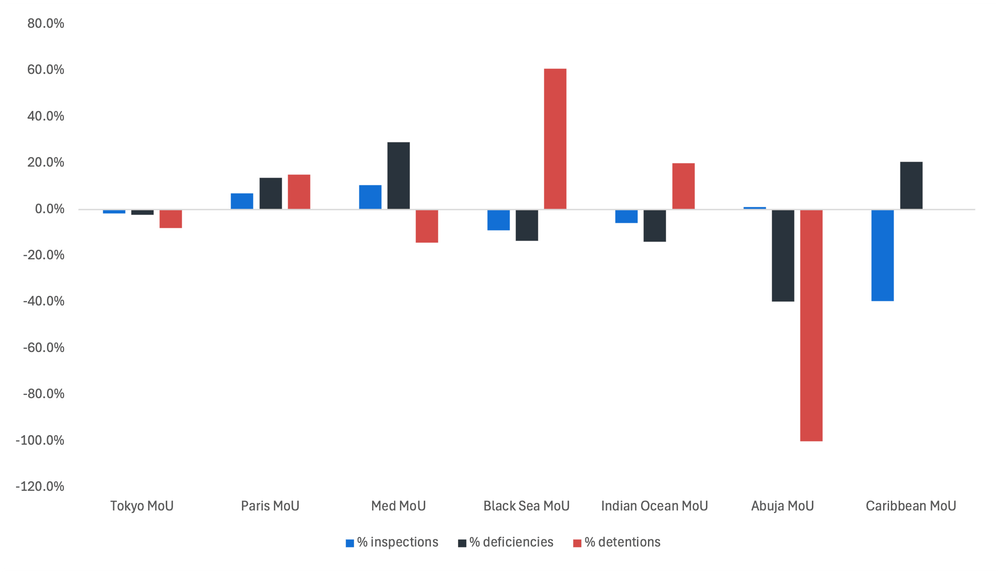
The Tokyo MoU, which accounts for the bulk of global PSC activity, remained broadly stable across all three indicators month-on-month, with inspections down a modest 1.7% and deficiencies down 2.3%, while detentions eased by 7.8%. The Paris MoU recorded gains across the board, with inspections up 7.1% and deficiencies up 13.7%, while detentions rose more sharply by 15.1%, pointing to firmer enforcement outcomes alongside higher activity levels. The Mediterranean MoU posted a mixed picture, with inspections up 10.7% and deficiencies up 29.1%, yet detentions fell 14.2%, indicating that increased activity did not translate into stricter enforcement outcomes this month. Meanwhile, the Black Sea MoU saw detentions surge by over 60% even as inspections declined 8.9% and deficiencies fell 13.4%, suggesting a notable strengthening in enforcement severity despite lower overall activity. The Indian Ocean MoU recorded a 20.1% rise in detentions against declines of 5.8% in inspections and 13.9% in deficiencies, again pointing to firmer enforcement intensity relative to its activity trend. Abuja and the Caribbean MoU both saw detentions remain at zero, with Abuja posting a broadly flat 1.1% rise in inspections against a sharp 39.6% drop in deficiencies, and the Caribbean MoU seeing inspections decline nearly 39.4% alongside a 20.6% rise in deficiencies, though both remain on a very limited baseline.
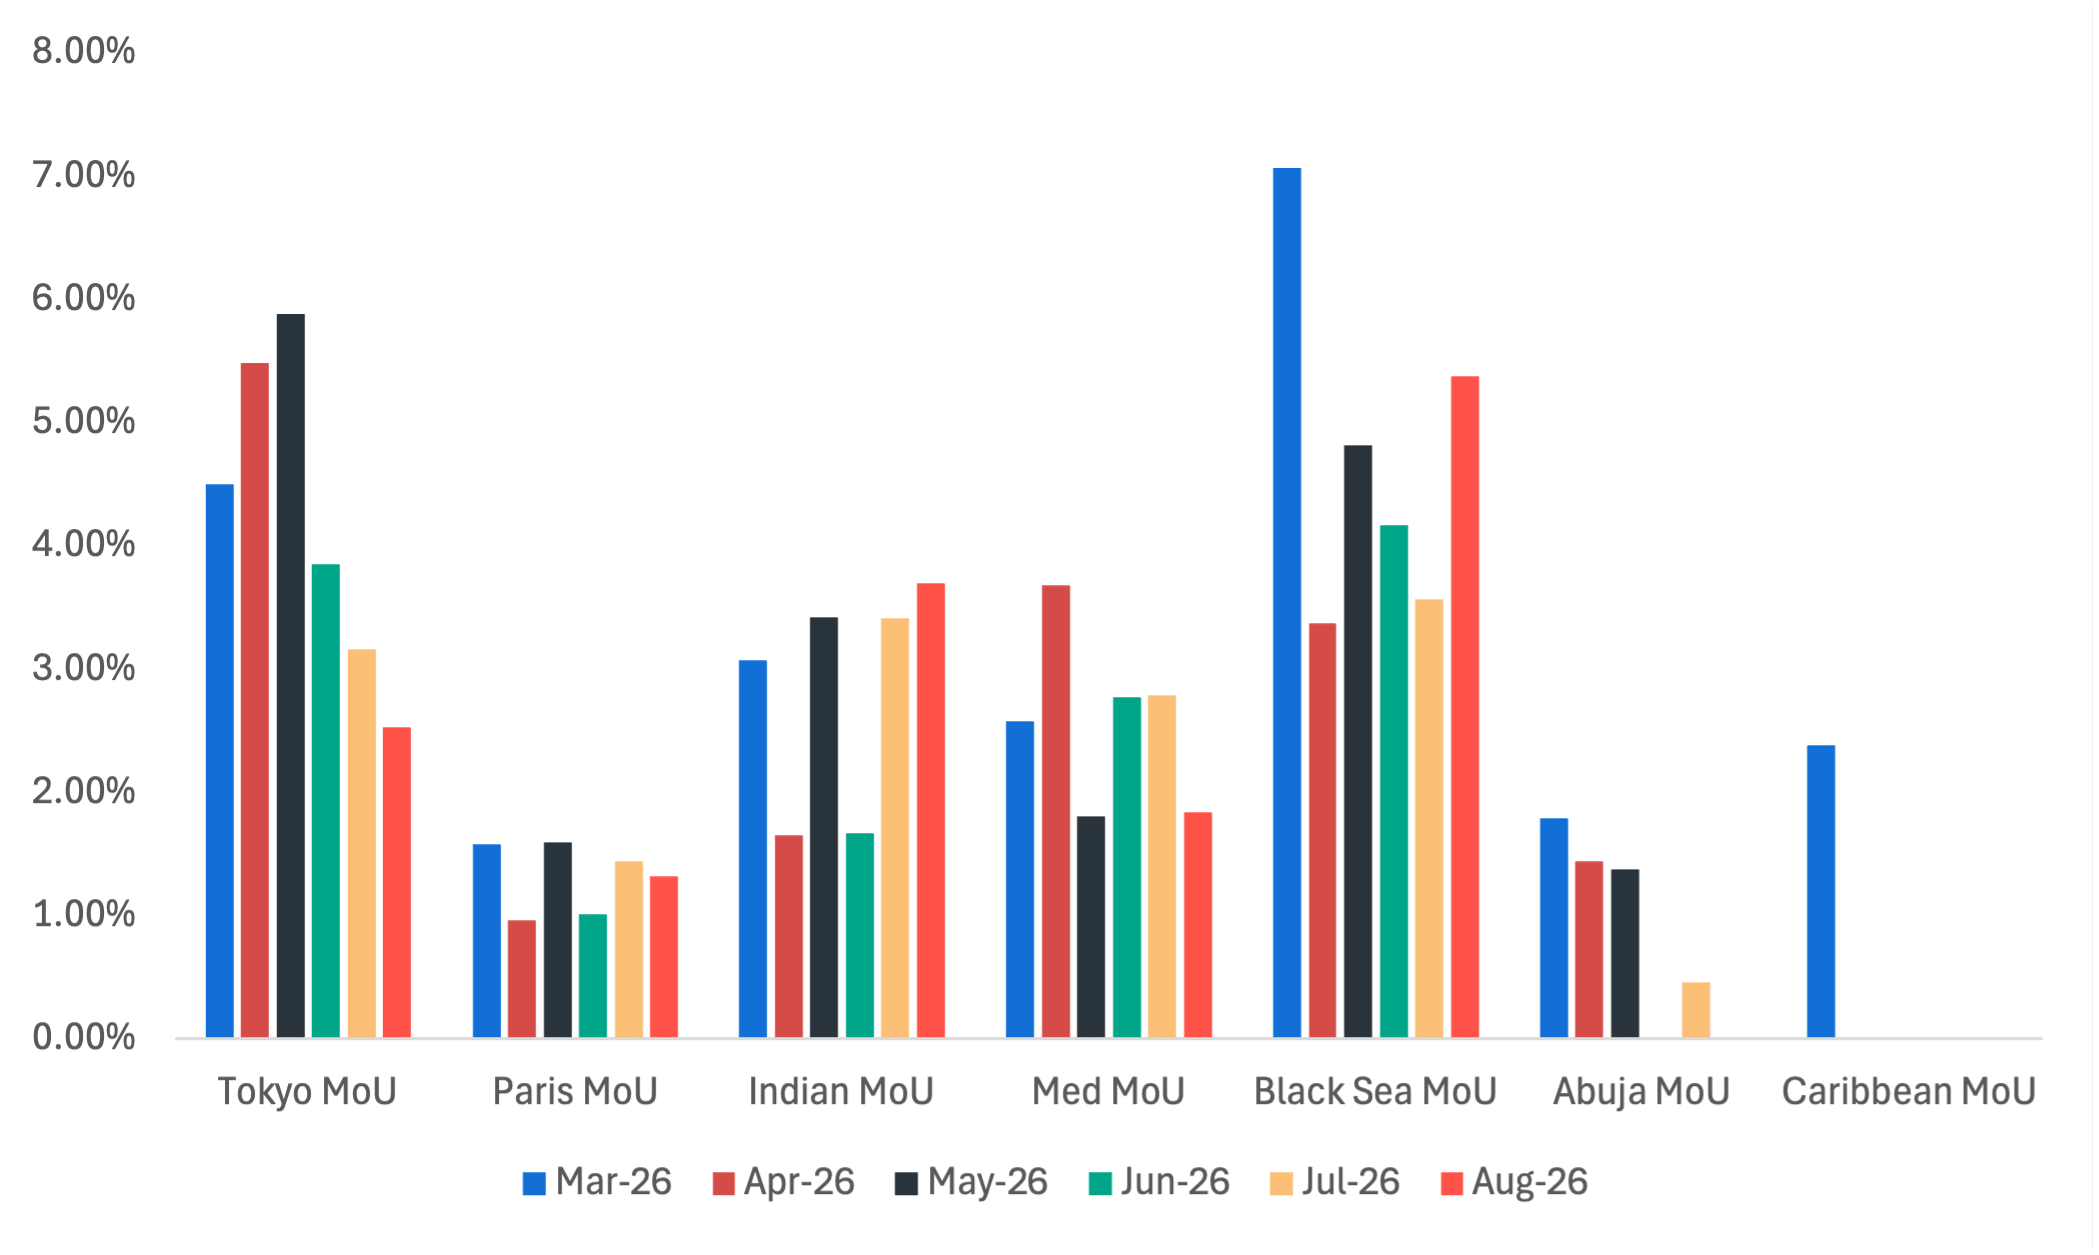 Graph 3. 6-Month Detention Rate Trends - Kpler.
The Black Sea MoU recorded the highest detention rate in August at 5.38%, rising sharply from 3.57% in July, though remaining below its six-month peak in March. The Indian Ocean MoU followed at 3.70%, extending its increase from 3.41% in July. In contrast, the Tokyo MoU declined further to 2.53% from 3.16%, continuing its retreat from the six-month high of 5.88% in May. The Mediterranean MoU fell to 1.84% from 2.79%, while the Paris MoU edged down to 1.32% from 1.44%, both remaining toward the lower end of their six-month ranges. Abuja fell back to 0% from 0.46%, while the Caribbean MoU remained at 0% for a sixth consecutive month, albeit amid limited inspection activity.
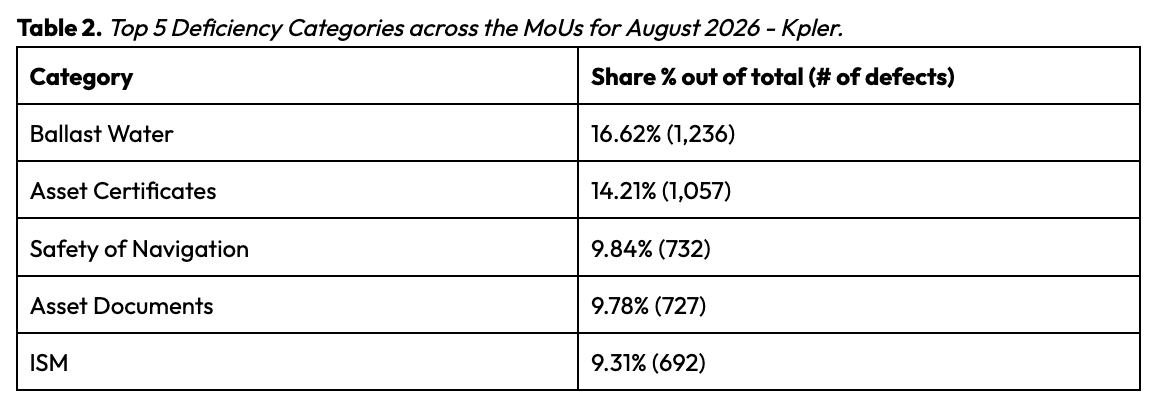
Ballast Water remained the leading deficiency category in August 2026, accounting for 16.62% of all recorded cases (1,236 deficiencies), reflecting the continued focus on environmental compliance. Asset Certificates followed with 14.21% (1,057 cases), remaining a key focus area linked to statutory certification and regulatory approvals. Safety of Navigation contributed 9.84% (732 cases), while Asset Documents represented 9.78% (727 cases). ISM rounded out the top five this month with 9.31% (692 cases). Collectively, these categories accounted for a substantial portion of total deficiencies across the MoUs, underscoring persistent operational and regulatory challenges.
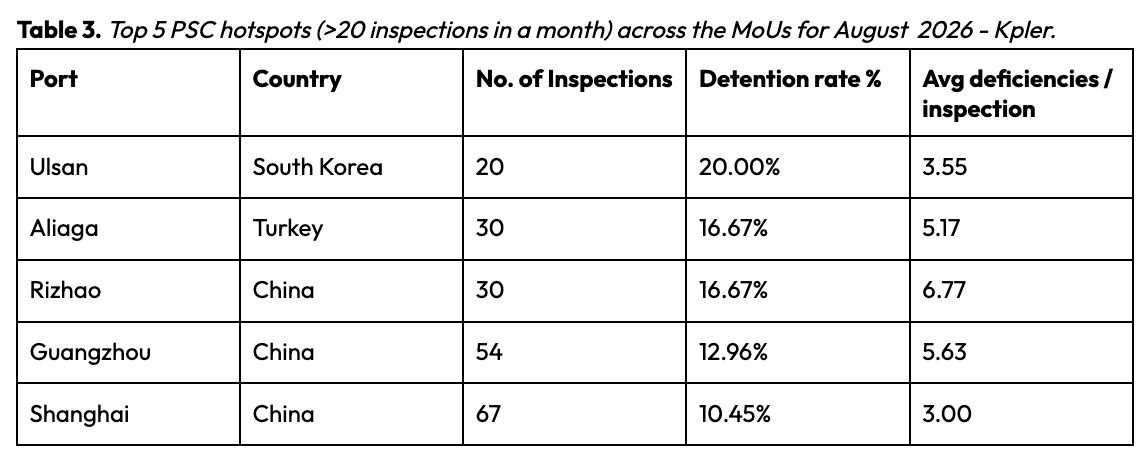
Ulsan (South Korea) recorded the highest detention rate this month at 20.00%, with an average of 3.55 deficiencies per inspection, marking it as the port with the highest detention risk relative to inspection volume in August. Aliaga (Turkey) and Rizhao (China) followed closely, each with a detention rate of 16.67%, though Rizhao's average of 6.77 deficiencies per inspection was notably higher than Aliaga's 5.17. Guangzhou (China) registered a detention rate of 12.96% with 5.63 deficiencies per inspection, while Shanghai (China) rounded out the list with the highest inspection volume among the hotspots at 67, but the lowest detention rate of 10.45% and 3.00 deficiencies per inspection. Overall, the identified hotspots this month spanned South Korea, Turkey, and China, highlighting elevated detention risk extending beyond East Asia to ports in the Eastern Mediterranean.
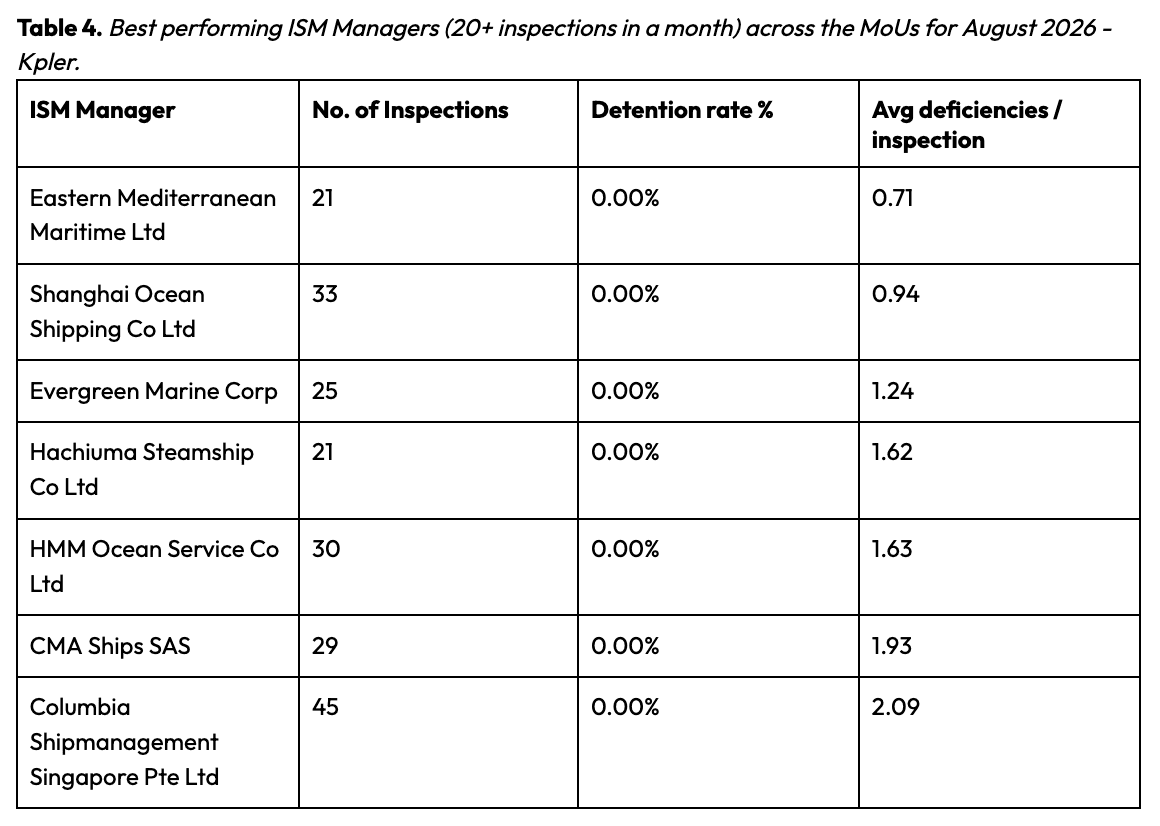
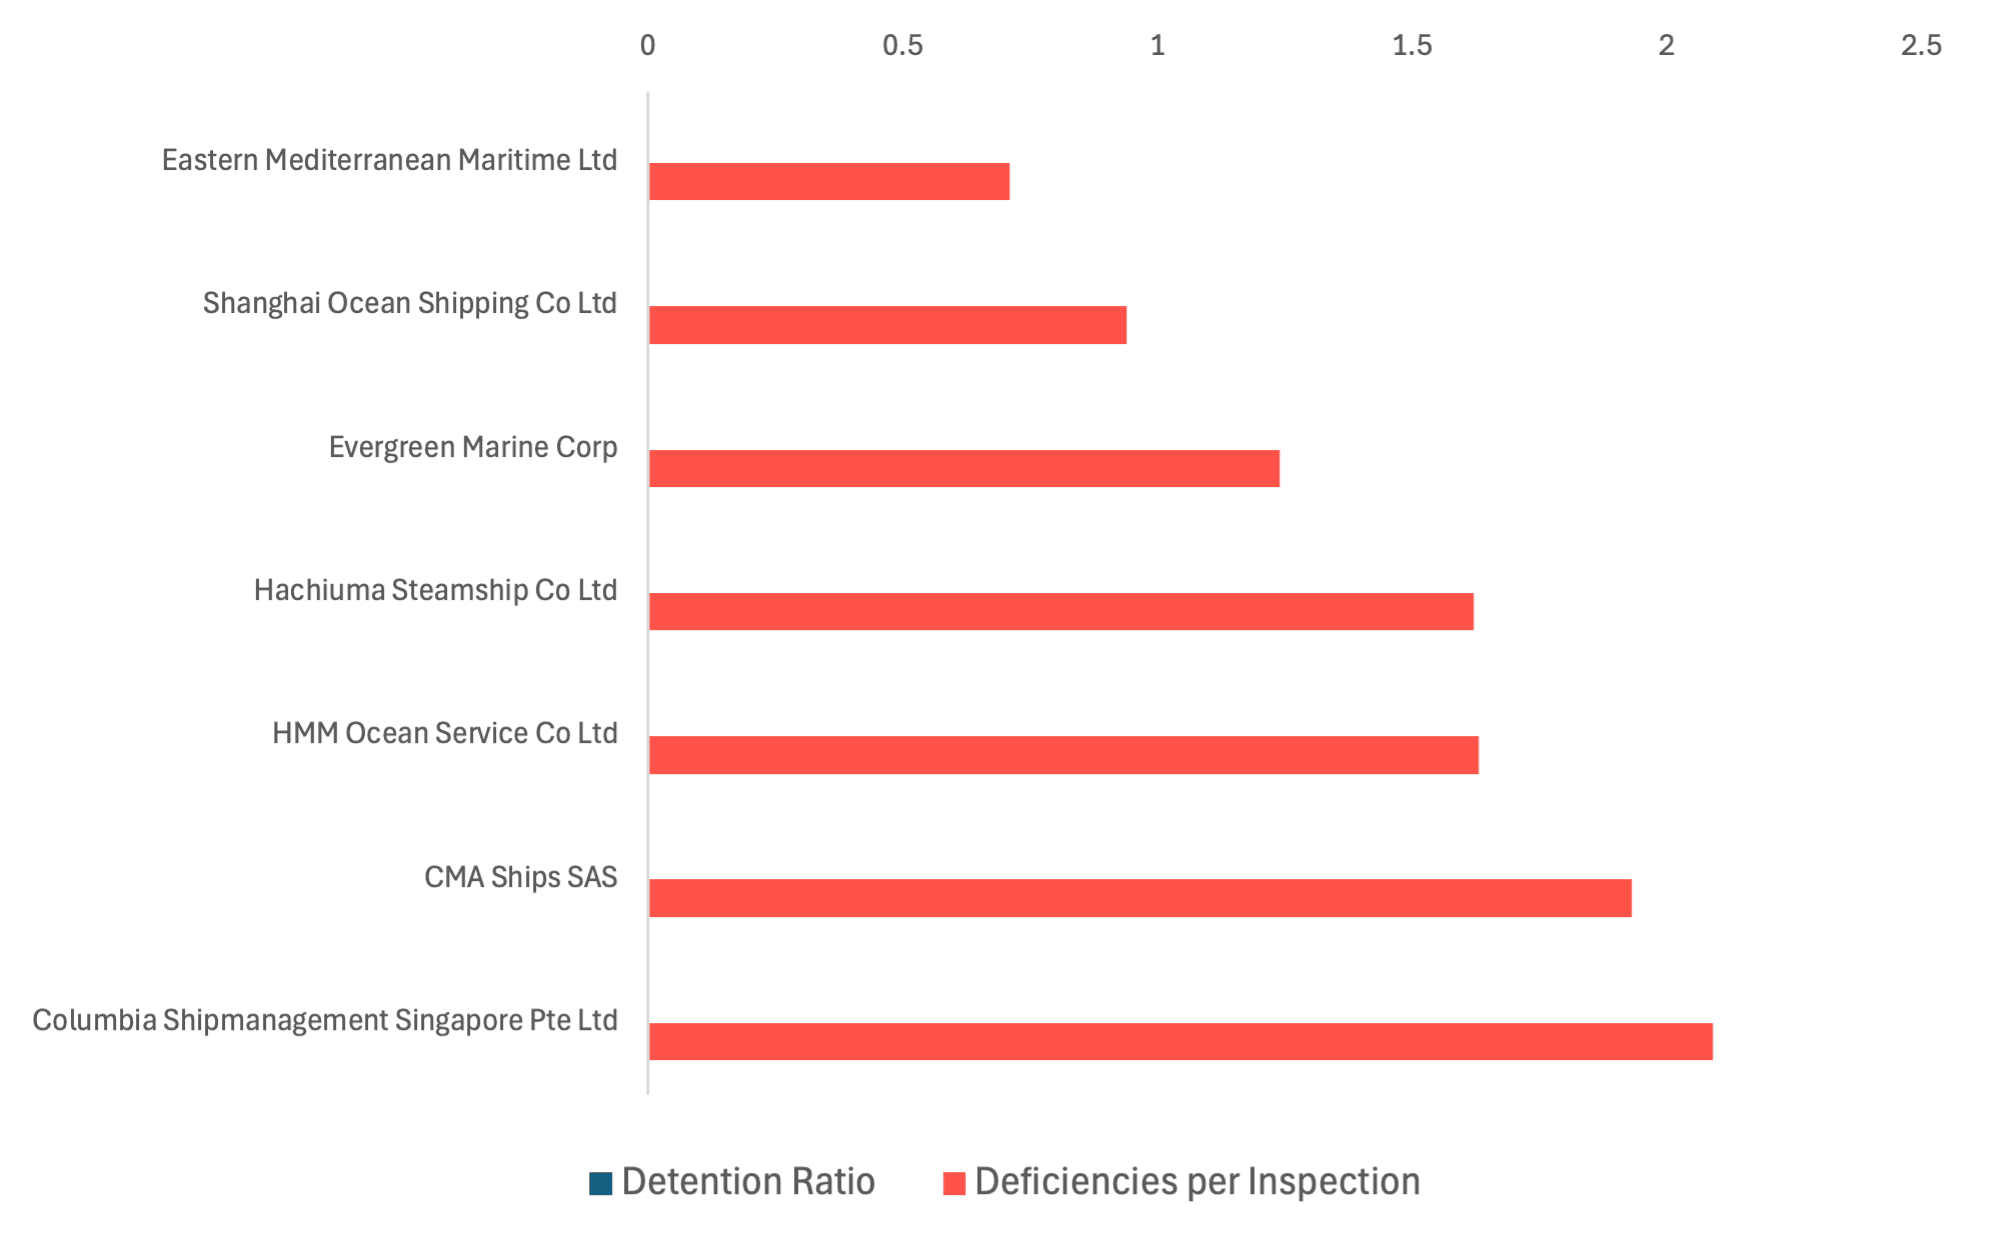 Graph 4. Best ISM Managers' performance (20+ inspections in a month) across the MoUs for August 2026 - Kpler.
Eastern Mediterranean Maritime Ltd recorded the lowest deficiency level in August 2026, averaging just 0.71 deficiencies per inspection across 21 inspections, reflecting strong compliance standards. Shanghai Ocean Shipping Co Ltd (33 inspections) followed with an average of 0.94 deficiencies per inspection. Evergreen Marine Corp (25 inspections) recorded an average of 1.24 deficiencies per inspection, while Hachiuma Steamship Co Ltd (21 inspections) and HMM Ocean Service Co Ltd (30 inspections) posted closely aligned averages of 1.62 and 1.63 deficiencies per inspection, respectively. CMA Ships SAS (29 inspections) recorded an average of 1.93 deficiencies per inspection, and Columbia Shipmanagement Singapore Pte Ltd (45 inspections) rounded out the group with an average of 2.09 deficiencies per inspection. All listed managers maintained zero detentions, demonstrating consistently strong compliance performance across the group.
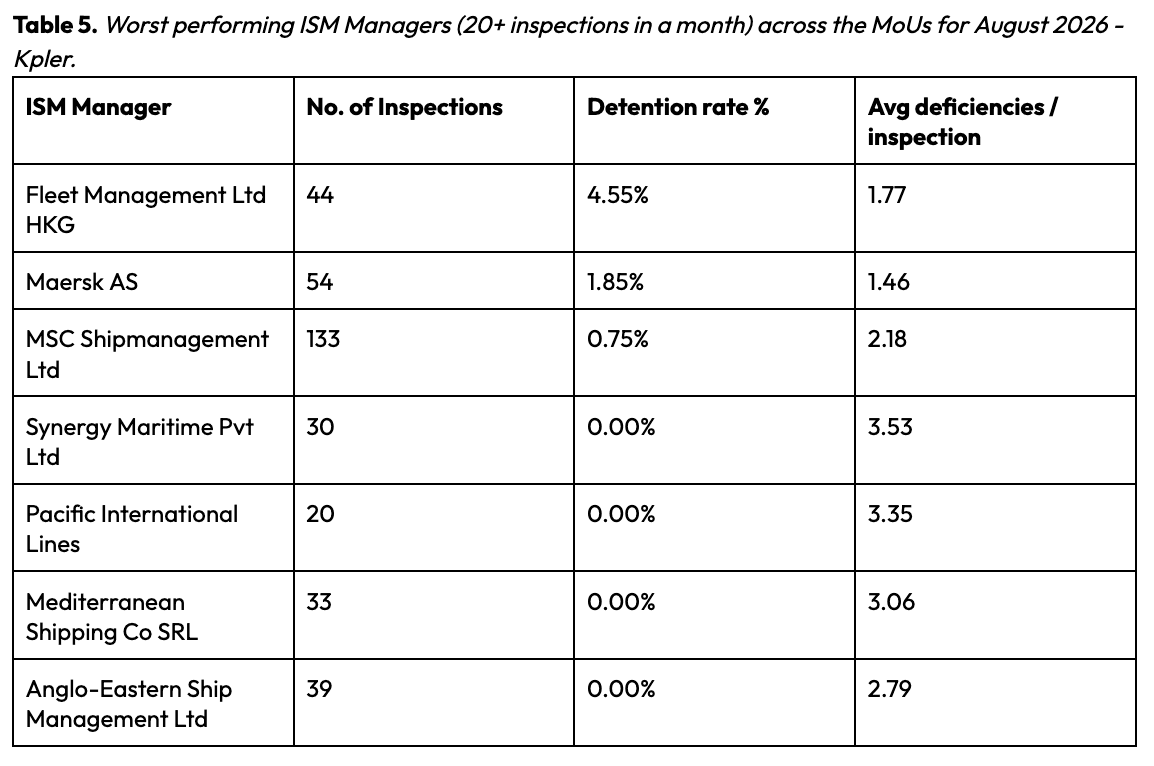
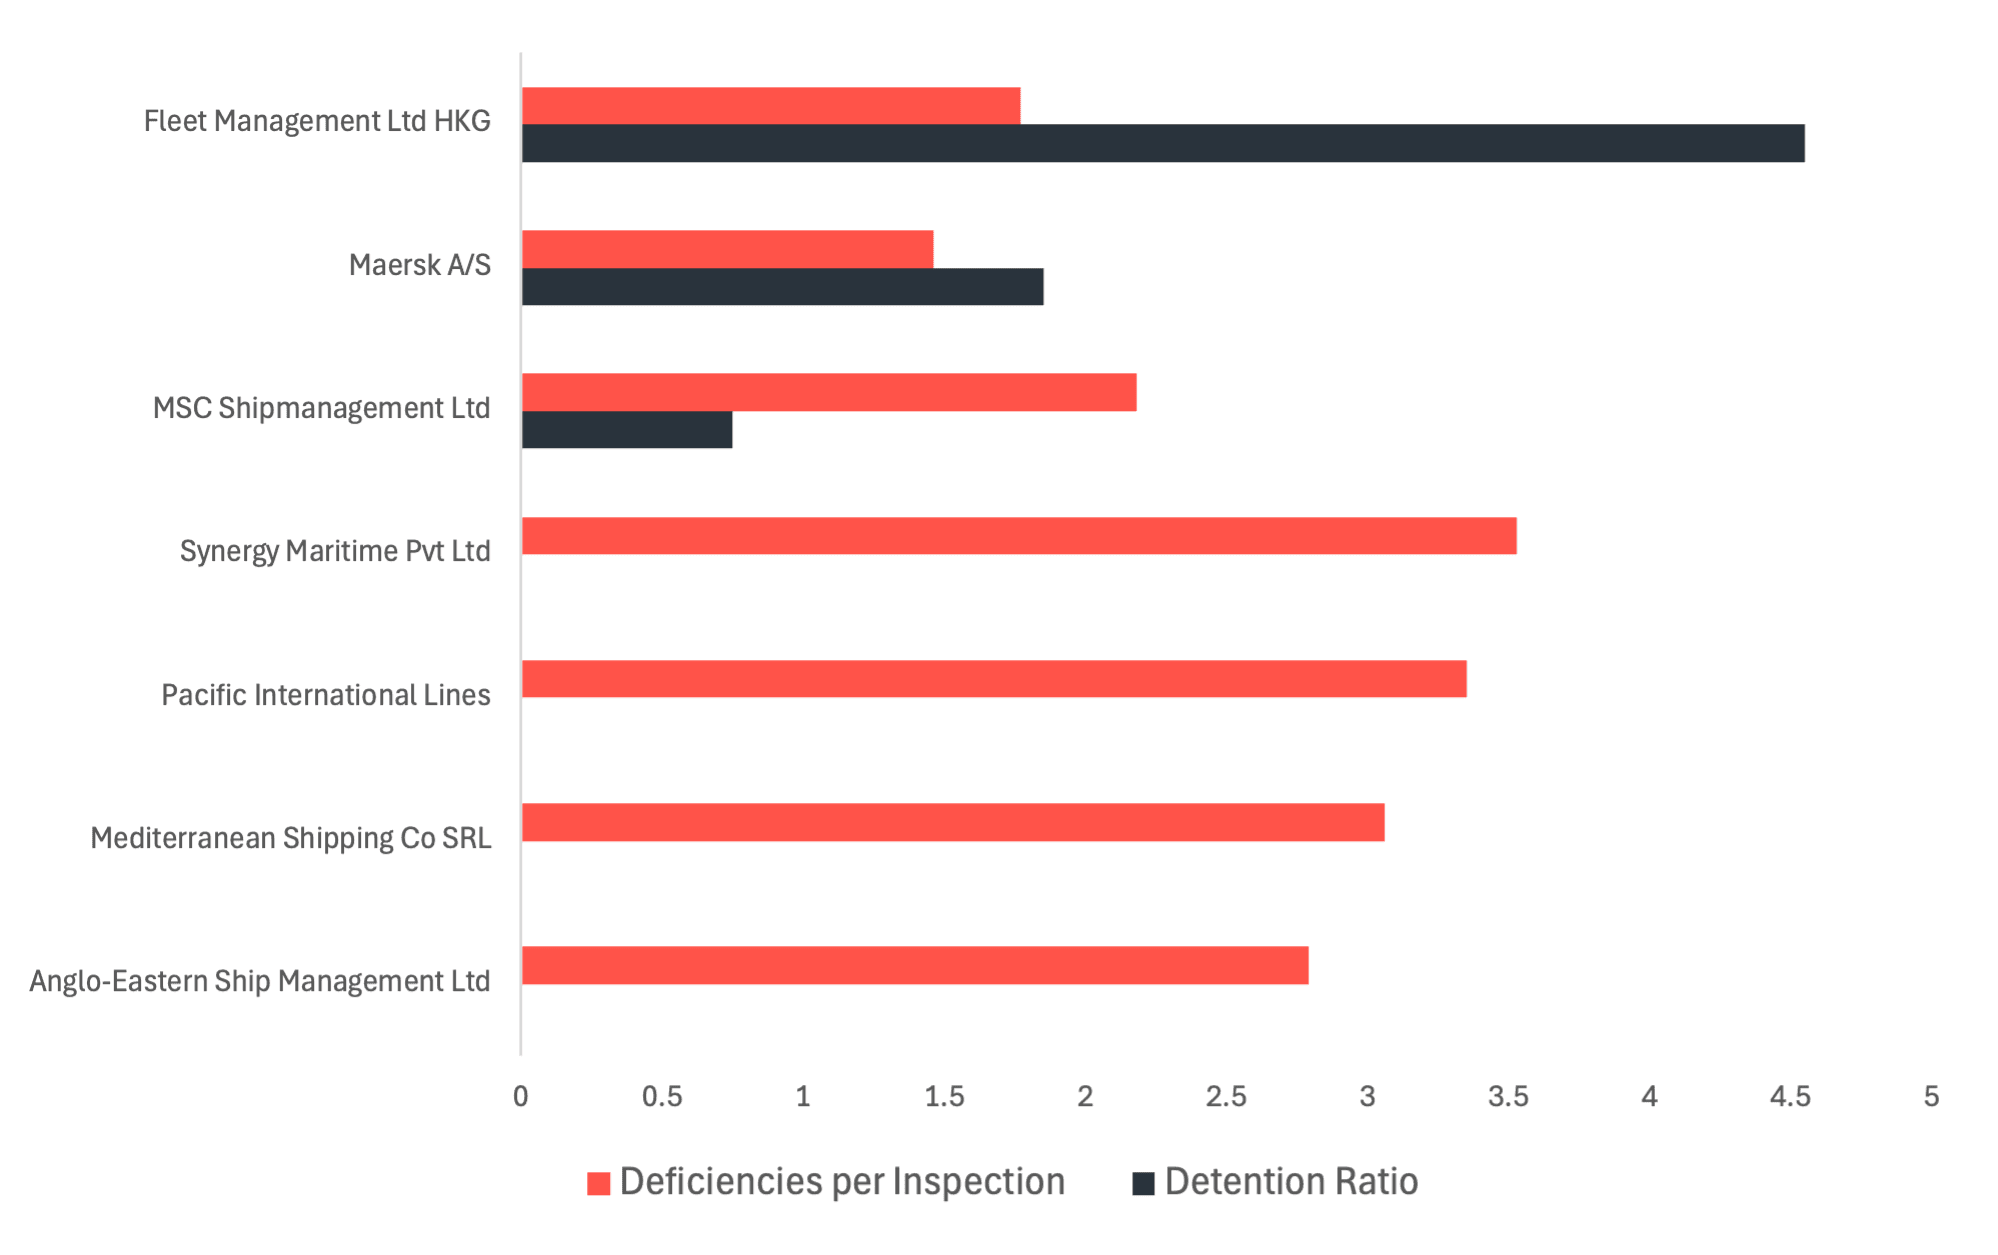 Graph 5. Worst performing ISM Managers (20+ inspections in a month) across the MoUs for August 2026- Kpler.
Fleet Management Ltd HKG recorded the highest detention rate in August 2026 at 4.55% across 44 inspections, marking the weakest performance among major ISM managers during the month, alongside a deficiency average of 1.77 per inspection. Maersk AS followed at 1.85% across 54 inspections, with a deficiency average of 1.46 per inspection. MSC Shipmanagement Ltd rounded out the managers with a non-zero detention rate at 0.75%, albeit across the largest inspection volume in the group at 133, with a deficiency average of 2.18 per inspection. The remaining four managers — Synergy Maritime Pvt Ltd (30 inspections), Pacific International Lines (20 inspections), Mediterranean Shipping Co SRL (33 inspections), and Anglo-Eastern Ship Management Ltd (39 inspections) — all recorded zero detentions this month, though each carried elevated deficiency averages of 3.53, 3.35, 3.06, and 2.79 per inspection respectively.